

Challenges before the start of collaboration
Every technical decision on a marketplace this size begins with a log file and at hundreds of millions of log lines a month log files stop behaving like files. The team could open them and they could read them, but reading is not analysis. Filtering was slow, queries were slower and the data itself came fragmented, because each service wrote its own logs in its own shape rather than feeding one complete picture of what bots were doing on the site.
Retention made that worse. Without dedicated infrastructure and at these volumes that infrastructure is expensive, logs survived 7 to 14 days. Two weeks of history is enough to notice that something broke on Tuesday. It is not enough to prove that a template change shipped in March is what moved Googlebot in May and on a site where releases land constantly, that gap is the difference between an opinion and a decision.
Crawl budget sat on top of that blind spot. Tens of millions of URLs compete for a finite number of Googlebot requests and without historical log data the team could not say which page types were absorbing them. The same applied to status codes: on a catalog that changes hourly, URLs flicker between 200, 404 and 503 and a URL that answers correctly for a user in a browser can be answering something else entirely for a bot at 3am.
Then there was the crawl itself. Parsing, segmenting and processing tens of millions of pages is limited by the machine you run it on and the machine was always the bottleneck.
Strategy and Execution
Logs as the Daily Instrument
Log analysis is the primary tool in this account and it runs on a fixed rhythm rather than on incidents.
Every week the team checks four things across the projects: whether the site is accessible to bots, what status codes bots are receiving, how fast pages respond and how the crawl splits between mobile and desktop. Every month the analysis goes deeper, working through logs by segment: which pages were crawled and whether those pages deserved the visit, which URLs flickered between status codes and what the Raw Logs report shows when you sit in it long enough to spot a pattern.
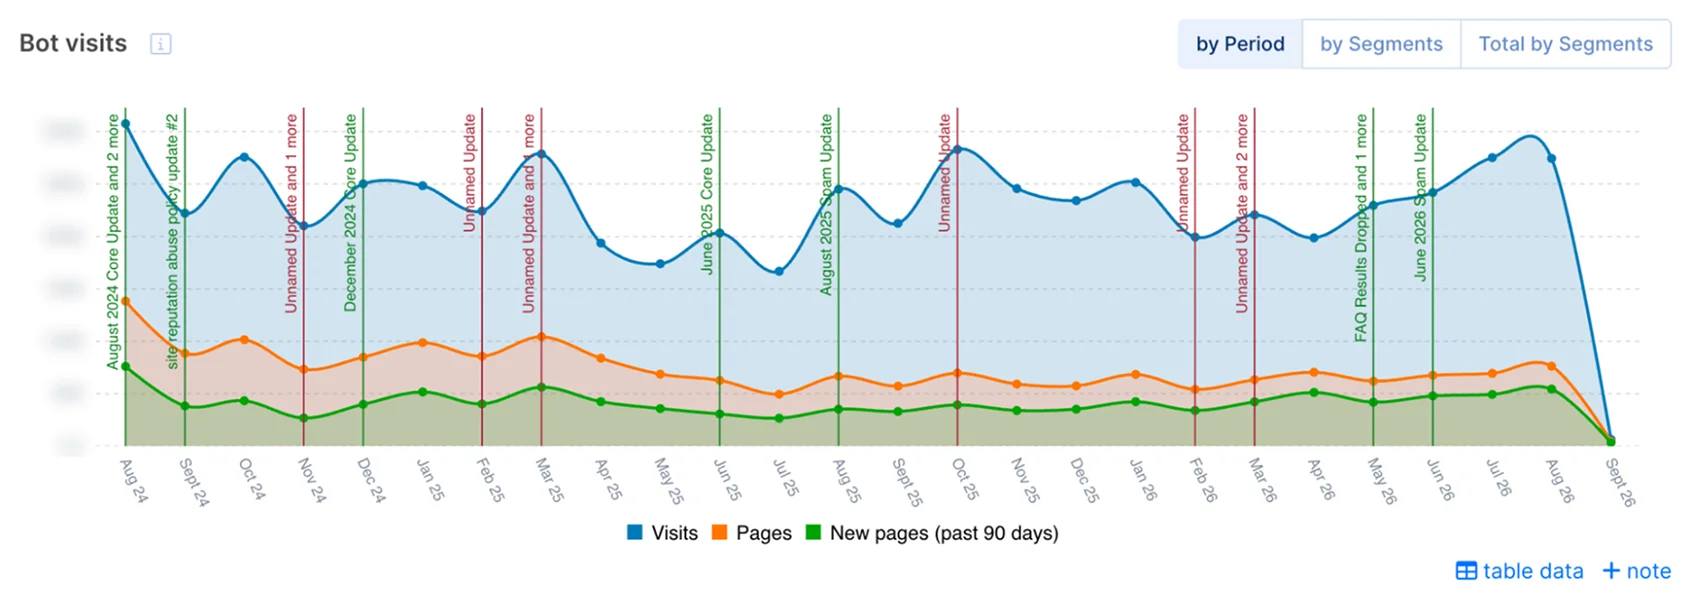
The same data closes the loop on development work. When the team ships a technical task connected to crawl budget, logs are how they measure whether it did anything.
“Log analysis is our main tool and we use it regularly. Weekly we check bot accessibility, status codes, load speed and the mobile to desktop split. Monthly we run a deeper technical analysis by segment, check which scanned pages were actually worth scanning, review the URLs where status codes were flickering and spend a lot of time in Raw Logs hunting for problems.”
Crawl Budget, Rebuilt on Historical Data
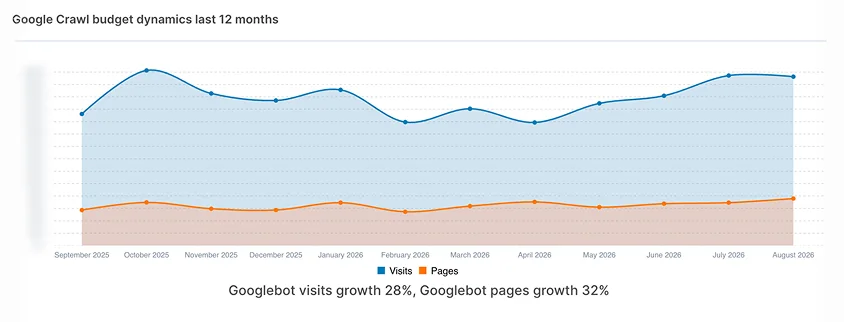
Historical logs, segments and filters gave the team the one view they never had: which page types Googlebot was actually spending its budget on. With that in front of them, the work became specific rather than theoretical. They analyzed where the requests were going, identified the categories of URLs that had no business consuming crawl budget and cut the volume of those pages.
Twelve months of that work show up as 28% more Googlebot visits and 32% more pages reached, year over year. The catalog barely grew in that time, so the extra crawl went where it was supposed to go: into pages that already existed and were not being visited often enough.
Your own crawl budget is already being spent somewhere.
Seven days of full access, no credit card.
Crawling Tens of Millions of Pages Without Waiting for a Machine
Crawl power is what makes the rest of the workflow possible at this volume. The team crawls at speed, uses presets for common problems to get from a crawl to a diagnosis without building reports from scratch and relies on the depth of the crawl settings to configure very different crawls for very different projects in the same account.
The most used feature is the least glamorous one. The site is dynamic, with optimization work and development releases landing continuously, so crawl comparison is how the team separates a deliberate change from an accident.
Status Codes and Alerts That Fire Before Google Notices
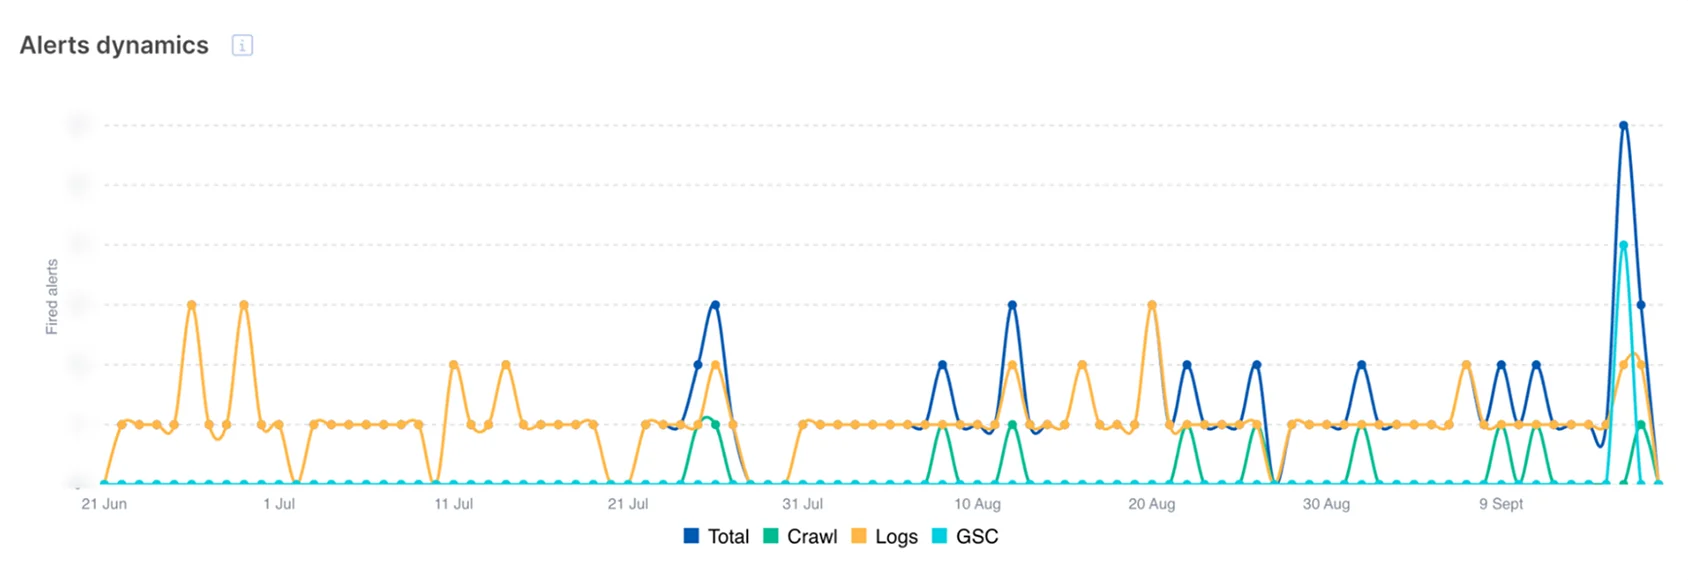
Status code monitoring runs permanently across the projects, with particular attention to URLs whose codes flicker, since those are the ones that quietly drain crawl budget and confuse indexation while looking fine in a browser. Alerts carry that monitoring outside working hours and cover both Googlebot and AI bots, so a technical problem surfaces as a notification rather than as a ranking drop three weeks later.
AI Bots Get the Same Treatment as Googlebot
Most enterprise teams are still deciding whether AI crawler traffic is worth measuring. This one already treats it as a standard log layer: availability, segments and problems, analyzed the same way Googlebot data is analyzed.
The biggest AI crawler on this marketplace is not OpenAI or Anthropic. It is Meta-ExternalAgent, by a multiple.
That is the kind of thing only logs tell you. AI crawler traffic here arrives at a volume most sites never see, none of it appears in analytics, and a team that is not reading logs is guessing about which systems are reading its products.
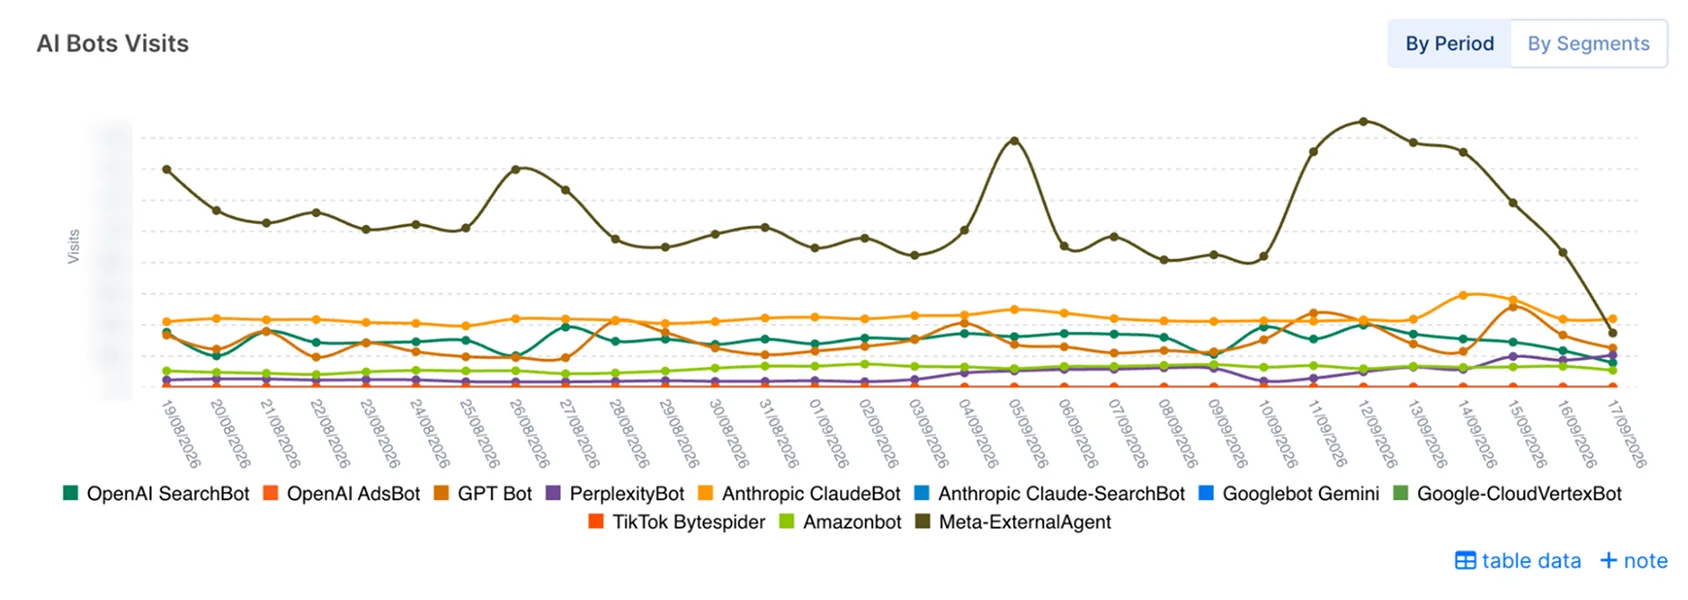
The JetOctopus log analyzer recognizes 40+ bots including GPTBot, ClaudeBot and PerplexityBot and verifies them against the vendors’ IP ranges, which filters out the spoofed requests that make raw log counts useless. For a marketplace whose product pages are exactly the kind of content LLMs pull from, knowing which AI bots arrive, where they go and what they receive is the top of a funnel that did not exist two years ago.
“The AI bot tooling is as powerful as the regular log analysis. It helps a lot with AI related problems: availability, segments, issues.”
Three Data Sources, One Screen
The combination the team names as most valuable is GSC plus crawl plus logs in a single tool, with ready presets for common problems sitting on top. Indexation work is where it pays off most directly, because no single source answers an indexation question on its own: the crawl shows noindex directives, canonicals and robots rules, the logs show what Googlebot actually requested and Search Console shows what Google did with the result.
The SEO Efficiency report puts those three datasets in one table, so a page type can be read across all of them at once: how many pages exist, how many the bot visited and how many earned impressions and clicks. Across an account this size that table is faster to act on than three separate exports.
The audience for that data turned out to be wider than the SEO team. With crawl and log data in one place, developers use the same platform to find technical problems that would otherwise surface as a support ticket.
A Lower Bar for Everyone on the Team
The change the team singles out as the biggest is an operational one. Analysis that used to require a specialist who knew what to look for, where to find it and how to write the query now requires a specialist who understands the problem domain and can use an interface.
On a team responsible for a portfolio this size, that difference decides how quickly a new hire becomes useful and how much senior time gets spent answering questions instead of solving them.
The Tool That Waited Two Years
Not every tool fits every site on day one and the AI-powered Internal Linker is the clearest example in this account. It is free forever on every JetOctopus plan and this team deliberately left it switched off, for a reason that says more about the site than about the tool: the structure is so branched that pages already carried a very large number of links, which dilutes anything a linker would add.
So the work was sequenced. First reduce the link volume per page, then let the linker distribute weight to the pages that need it. That cleanup is done and the Internal Linker is now running on the account.
Achieved Results
Some of what changed is measurable in charts. The rest shows up in how the team works.
- Googlebot visits up 28% and Googlebot pages up 32% over twelve months, measured in the platform rather than estimated.
- One account for 10+ projects, with tens of millions of pages and hundreds of millions of log lines processed every month under a single set of segments.
- A fixed monitoring routine, weekly for accessibility, status codes, speed and device split, monthly for deep segment analysis, instead of ad hoc investigation after something breaks.
- Technical problems caught by alerts for both Googlebot and AI bots, rather than discovered in traffic reports.
- A shorter path from hire to analyst, because the platform took the query writing skill out of the job description.
- Value outside the SEO team, with developers using crawl and log data to find technical issues on the site.
“We recommend JetOctopus constantly. There are many advantages and which one we lead with depends on the request or the task in front of us.”
Takeaways
At hundreds of millions of log lines a month, the constraint on technical SEO stops being knowledge and becomes throughput. This team knew what they wanted to look at long before they had a way to look at it and what changed was the ability to put a question to a month of logs and get an answer the same afternoon.
Three things carried the most weight. Historical log data turned crawl budget from an argument into a measurement and twelve months later Googlebot reaches 32% more pages than it did, on a catalog of the same size. That is crawl that used to go to URLs nobody needed indexed. Crawl comparison made continuous releases safe to ship. Having crawl, logs and Search Console in one interface lowered the experience needed to do the analysis at all, which across a portfolio this size is a hiring advantage as much as a technical one.
The Internal Linker is the part worth keeping in view. It sat unused for years while the site was not ready for it and it went live only after the team fixed the thing that would have made it useless.
Run Your Own Numbers
If your site produces more log lines than your tooling can hold or your crawls finish long after the release they were meant to check, our team will walk through your setup on a live call and show you these same reports on your own data.