When it comes to SEO, it is dangerously easy to drown in data. Technical audits, keyword rankings, backlink counts, crawl stats – the list never ends. But data alone does not grow a business. That is where SEO KPIs come in.
SEO KPIs (Key Performance Indicators) are the select few metrics that connect your organic search activity directly to business outcomes: revenue, customer acquisition and market share. They answer the question your CMO or CEO is actually asking: Is our investment in organic search paying off?
SEO metrics are diagnostic while SEO KPIs are strategic. Metrics tell you what is happening on your site. KPIs tell you whether your SEO program is succeeding as a business function. Tracking the right KPIs allows you to move away from vanity numbers, justify budgets to stakeholders and make decisions that drive compounding organic growth.
In this guide, we cover 13 of the most important SEO KPIs to track, how to measure each one, realistic benchmarks to aim for and how to report them effectively to executives and clients.
SEO KPI Examples: All 11 KPIs at a Glance
Before we go deep on each one, here is a high-level overview of the core SEO KPIs, their business value and the tools you need to track them:
| SEO KPI | Business Value | Primary Tracking Tools |
|---|---|---|
| Organic Traffic Volume | Foundation metric – shows total reach of organic search. | GA4, Google Search Console |
| Organic Conversions | Directly ties SEO traffic to revenue and lead generation. | GA4 |
| Organic CTR | Measures how compelling your SERP snippets are to searchers. | Google Search Console |
| Keyword Rankings | Tracks position for target queries; best used alongside SOV. | GSC, JetOctopus |
| Search Visibility (SOV) | Measures overall market share in SERPs vs. competitors. | JetOctopus |
| SEO ROI | Proves the financial profitability of your organic campaigns. | GA4 + Internal Financial Data |
| Organic CPA | Shows how cost-efficiently SEO acquires new customers. | GA4 + Internal Financial Data |
| Customer Lifetime Value (CLV) | Reveals the long-term revenue quality of organic customers. | CRM + GA4 |
| Non-Branded Traffic Growth | Indicates new audience capture beyond existing brand awareness. | Google Search Console |
| Technical Crawl Efficiency | Ensures Googlebot and AI bots prioritize your most profitable pages. | JetOctopus, Log Analyzers |
| AI Search Visibility | Tracks brand presence in AI-generated answers and zero-click results. | JetOctopus |
1. Organic Traffic Volume
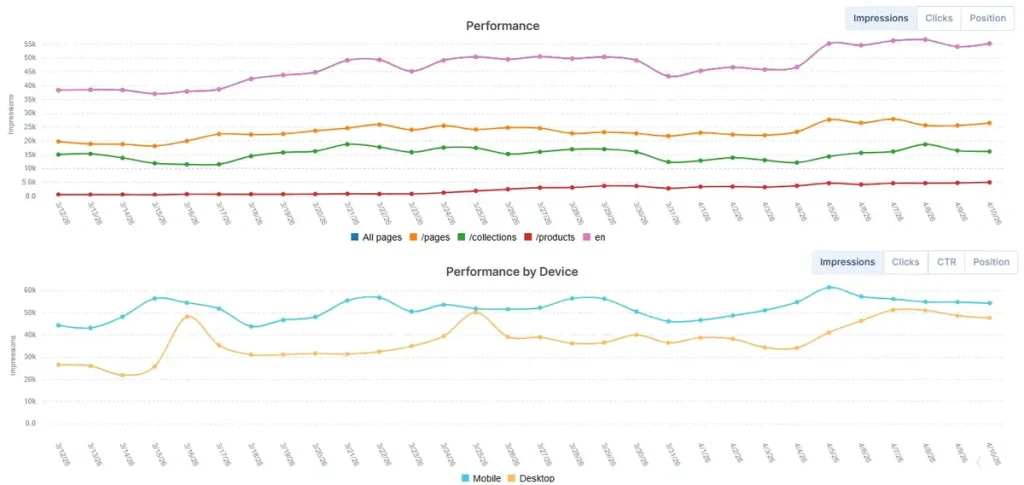
Organic traffic volume is the total number of sessions or users arriving at your site from unpaid search results in a given period. It is the foundational SEO KPI – the top-of-funnel measure that feeds every downstream business metric. Without sufficient organic traffic, conversions, leads and revenue from organic search simply cannot scale.
Why it matters: Organic traffic is the clearest indicator of your overall SEO reach. Growth in organic traffic means your content is indexing, ranking and attracting clicks. Decline in organic traffic is typically the first signal of algorithm impact, technical issues or competitive pressure – and catching it early is critical.
How to track it: In Google Search Console, navigate to Performance > Search Results and review Total Clicks to see organic sessions from Google. In GA4, go to Acquisition > Traffic Acquisition and filter by Organic Search channel for a broader view across all search engines. Always segment by landing page to identify which content is driving or losing traffic.
Benchmark to aim for: Organic traffic growth benchmarks vary widely by industry and site maturity. A healthy content-driven site typically targets 15–25% year-over-year organic traffic growth. More important than any external benchmark is a consistent upward trend.
2. Organic Conversions
If there is one non-negotiable SEO KPI, it is organic conversions. An organic conversion is any valuable action a user completes after arriving from a non-paid search result – a completed purchase, a booked demo, a free trial sign-up or a whitepaper download. The specific conversion events depend on your business model.
Why it matters: Traffic without conversions is noise. Tracking organic conversions is the clearest, most defensible way to tie SEO activity to actual revenue generation. It also reveals whether you are attracting the right audience, not just high volumes of unqualified visitors.
How to track it: In GA4, mark high-value events – such as ‘purchase’ or ‘generate_lead’ – as key events. Filter out Organic Search and you can see exactly how many conversions SEO drove in any given period. Use GA4’s data-driven attribution model to understand organic search’s role across the full customer journey, not just as the final click.
Benchmark to aim for: E-commerce typically sees organic conversion rates of 1–3%; B2B SaaS can range from 2–5% for free trials. More important than any industry average is a consistent upward trend in your own data over time.
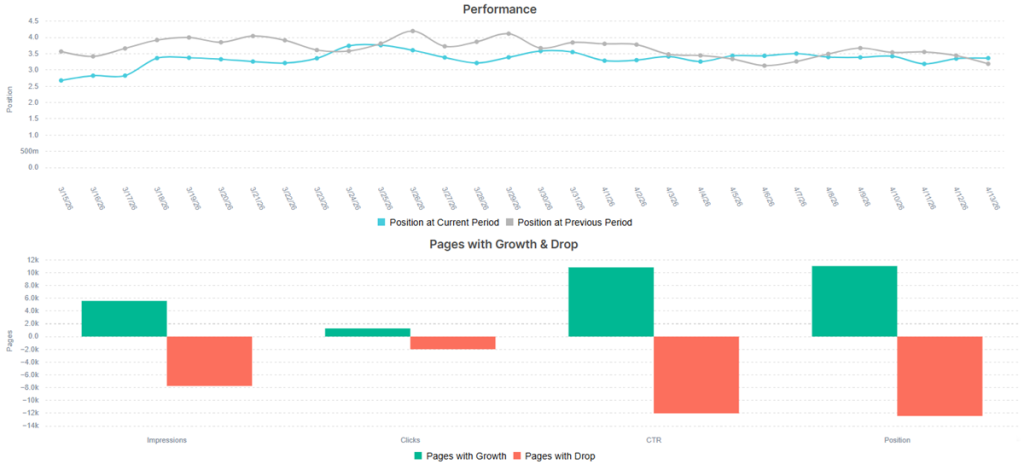
3. Organic Click-Through Rate (CTR)
Organic CTR is the percentage of users who click on your search result after seeing it in the SERPs. It is calculated as total clicks divided by total impressions for any given page or query.
Why it matters: You can rank on page one and still lose significant traffic if your title tag and meta description fail to persuade users to click. CTR is the bridge between visibility and actual traffic – and improving it is one of the highest-ROI quick wins available to any SEO team, because it generates more traffic without requiring any new rankings.
How to track it: Google Search Console is the primary tool for CTR data. Check the data by pages to identify the ones with lowest-CTR and high impressions – these are your biggest optimization opportunities. For example, a page ranking in position 3 with a 2% CTR, when, based on your data, the average for that position is 10%, represents a significant traffic gap that a better copy can fix.
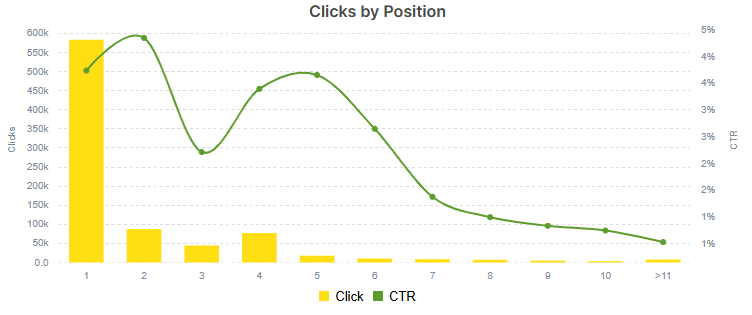
Benchmark to aim for: Average organic CTR varies significantly by position. Position 1 typically delivers 15–17% CTR (depending on SERPs features), position 3 around 8–11% and anything below position 5 usually falls below 5%. Any page with impressions above 1,000 per month and a CTR significantly below its position average is a priority for snippet optimization.
4. Keyword Rankings
Keyword rankings measure the position your pages hold in search engine results for specific target queries. They are one of the most widely tracked SEO data points – and also one of the most frequently misused.
Why it matters – and where rankings fall short: Rankings are a useful leading indicator. For example, improving from position 12 to position 4 for a high-volume keyword is a meaningful signal of progress. Since on 4th position the CTR is higher than on 12th, the website will get more organic clicks.
However, relying on individual rankings as your primary KPI is misleading for three reasons:
- search results are personalized by location and browsing history;
- a site can rank highly for many terms but still have low overall market share;
- a single ranking movement tells you nothing about aggregate visibility or business impact.
The right way to use keyword rankings: Track rankings as a supporting metric that validates the direction of your Search Visibility (Share of Voice) KPI. Use a representative sample of your most important target keywords to confirm that visibility gains are being driven by the right queries. Pay particular attention to keywords in positions 4–10, as these represent the highest-leverage ranking improvement opportunities – moving from page one’s lower half to the top three has a disproportionate impact on CTR and traffic.
How to track it: Google Search Console’s Performance report provides position data for free, though it represents an average across devices and locations.
5. Search Visibility (Share of Voice)
Search visibility – often called Share of Voice (SOV) in the context of SEO – measures how visible your domain is across the entire landscape of your target keywords, not just one or two tracked terms. It is the aggregate, market-level view of your organic presence.
Why it matters: Where individual keyword rankings can be misleading (due to personalization, location variance and algorithm flux), Search Visibility aggregates your rankings and estimated click-through rates across hundreds or thousands of tracked keywords into a single percentage representing your total share of the available search market. Research consistently shows a strong correlation between SOV and actual market share.
How to track it: Enterprise tools like JetOctopus calculate Share of Voice automatically. Build a keyword set representing your core industry topics, feed it into a rank tracker and the tool calculates what percentage of total possible clicks you are capturing compared to competitors.
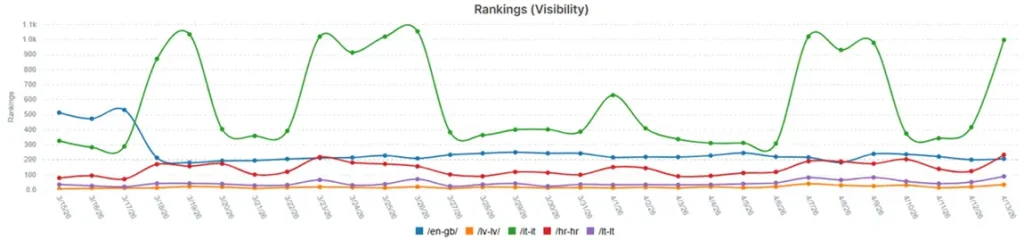
Benchmark to aim for: In most competitive verticals, a share of 10–20% is strong for a non-dominant player. The key metric is directional growth – visibility trending up month-over-month compared to competitors.
6. SEO Return on Investment (ROI)
SEO ROI measures the financial profitability of your organic search activities relative to its total cost – including agency fees, in-house salaries, content production and tool subscriptions.
Why it matters: Stakeholders and finance teams need evidence that SEO is generating a positive return. A growing ROI validates strategy, secures future budget and positions the SEO team as a revenue driver – not a cost center.
How to calculate it:
SEO ROI = ((Revenue from Organic Search − Cost of SEO) / Cost of SEO) × 100
For example: if you spend $5,000 per month on SEO and organic traffic generates $22,000 in revenue, your SEO ROI is 340%. Track this quarterly rather than monthly to account for the compounding, delayed nature of organic results.
Benchmark to aim for: A mature SEO program targeting informational and transactional content should deliver a positive ROI within 6–12 months. Once established, top-performing programs routinely achieve ROI multiples of 5x to 12x – well above most paid channels.
7. Cost Per Acquisition (CPA) from Organic Search
Organic CPA measures how much it costs to acquire one paying customer or qualified lead through organic search. It is the efficiency twin of ROI.
Why it matters: If organic traffic is growing but CPA is rising, your strategy is attracting unqualified visitors. A steadily declining organic CPA indicates your content is maturing, your site authority is compounding and your acquisition engine is becoming more efficient over time – a dynamic that no paid channel can replicate at scale.
How to calculate it:
Organic CPA = Total SEO Spend / Number of Organic Conversions
Example: $10,000 in Q1 SEO spend generating 400 organic conversions = an organic CPA of $25. Compare this to your paid CPA to contextualize the long-term value of organic investment.
8. Customer Lifetime Value (CLV) from Organic
Customer Lifetime Value measures the total revenue a business can expect from a single customer over the entire course of their relationship. When segmented by acquisition channel organic CLV reveals whether SEO is not just driving conversions – but driving the right kind of customers.
Why it matters: Two channels can deliver the same CPA and still have dramatically different business value if customers acquired through one channel churn faster or spend less. In practice organic search often attracts higher-intent customers who researched before converting – and these customers tend to exhibit lower churn rates and higher long-term spend than those acquired through paid or social channels. Tracking organic CLV makes this advantage visible in business terms.
How to track it: CLV from organic requires connecting your CRM or subscription billing data with GA4’s organic channel attribution. In practice, this means tagging users by acquisition channel at sign-up, then tracking their revenue contribution over time in your CRM (e.g., HubSpot, Salesforce, ChartMogul). While this requires more setup than most KPIs, it is especially valuable for SaaS and subscription businesses where the ratio of CLV to CPA is the ultimate profitability signal.
Benchmark to aim for: A healthy CLV:CPA ratio for organic search is typically 3:1 or higher. If organic CLV is significantly above your paid channel CLV at the same CPA, this is powerful evidence for increasing SEO investment at the expense of paid spend.
9. Branded vs. Non-Branded Traffic Growth
Branded traffic comes from users searching explicitly for your company name or product (e.g., “JetOctopus” or “JetOctopus log analyzer”). Non-branded traffic comes from users searching generic industry terms (e.g., “crawl budget optimization” or “log file analysis for SEO”).
Why it matters: Branded traffic growth is valuable, but it is largely driven by brand awareness activities like PR, social and advertising – not SEO. Non-branded organic traffic growth is the purest signal that your SEO strategy is capturing net-new demand from users who had no prior awareness of your brand.
How to track it: In Google Search Console, navigate to the Performance report and create a query filter to exclude terms containing your brand name. The resulting data shows you only non-branded clicks and impressions. Monitor this trend monthly and track the ratio of non-branded to branded traffic over time.
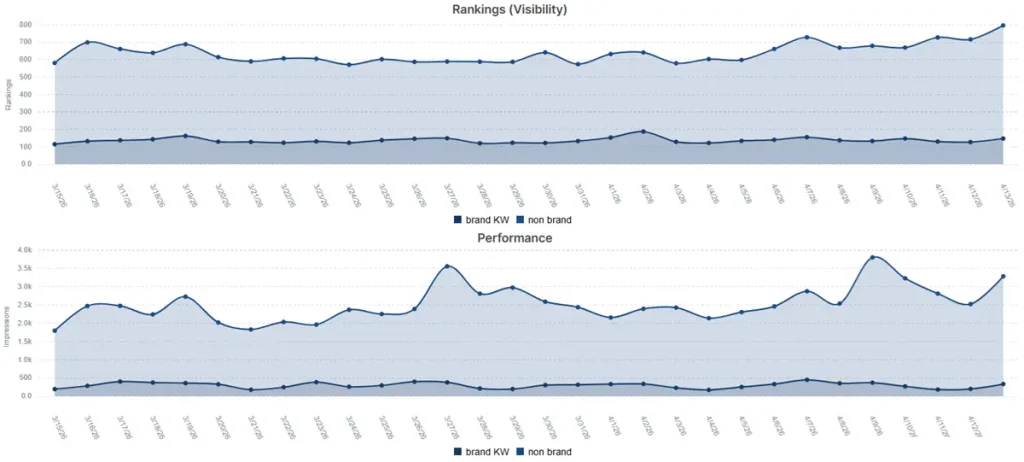
Benchmark to aim for: For most businesses, non-branded traffic should represent 60–80% of total organic clicks if the content strategy is performing well. A rising non-branded share is one of the clearest indicators of genuine SEO progress.
10. Technical Crawl Efficiency (The Enterprise SEO KPI Most Teams Ignore)
Technical SEO is often treated as a checklist of diagnostic fixes – resolving 404s, improving Core Web Vitals, adding schema markup. These are valuable, but for enterprise and large-scale websites, technical health needs to be elevated to a true business KPI. Specifically: Crawl Budget Efficiency.
What is Crawl Budget Efficiency? Every website has a crawl budget – a finite limit to how many pages Googlebot will crawl in a given timeframe. If Googlebot spends 50% of its crawl budget on low-value faceted navigation URLs, paginated archive pages or internal search results pages, it is spending proportionally less time on your high-converting product pages, revenue-driving category pages and freshly published content.
Same relates to AI bots too: all pages that weren’t found and crawled – won’t be used to compute answers mentioning your brand and linking to your website. But we’ll cover this in the next section.
Why it matters: Wasted crawl budget directly suppresses indexation of your most profitable pages, delays ranking improvements after content updates and erodes SEO ROI. For websites with hundreds of thousands or millions of URLs – e-commerce stores, SaaS knowledge bases, large publishers – this is not a minor technical detail. It is a revenue issue.
The KPI to track: Crawl Budget Efficiency = the percentage of total Googlebot hits landing on revenue-generating or priority pages vs. wasted or low-value pages. Pairing this with the Indexation Rate of Critical Pages – what percentage of your most important URLs are actually indexed – gives you a direct line between technical health and business outcomes.
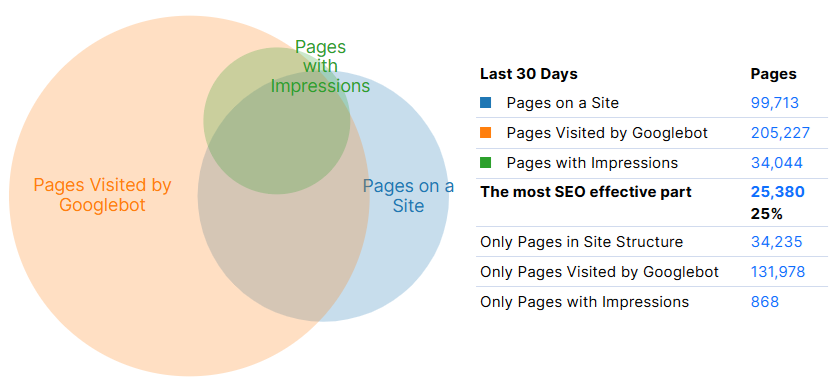
How to track it: This requires server log file analysis – not just GSC data, which is sampled and aggregated. Tools like JetOctopus are purpose-built for this. JetOctopus processes raw server log files to show exactly how search bots behave on your site: which URLs they visit, how often, at what depth and how that crawl activity maps to your indexed pages. By cross-referencing server logs with your segmented URL structure, you can pinpoint exactly where crawl budget is being wasted and take targeted action – through robots.txt rules, canonicalization, internal linking restructure or XML sitemap refinement – to redirect bot attention to your money pages.
At JetOctopus, we see this play out repeatedly with enterprise clients: redirecting just 15–20% of wasted Googlebot hits toward priority pages can unlock meaningful ranking improvements within a single crawl cycle.
11. AI Search Visibility (Generative Engine Optimization)
The search landscape is shifting faster than at any point since the mobile revolution. Google AI Overviews, ChatGPT, Perplexity, Gemini and other large language models (LLMs) are increasingly answering user queries directly, without the user ever clicking a link. This is the world of Answer Engine Optimization (AEO) and Generative Engine Optimization (GEO) – and tracking your presence in it is now a mandatory enterprise SEO KPI.
Why it matters: If your website is not being cited as a source in AI-generated answers, you are invisible to a rapidly growing segment of searchers. Beyond citations, AI engines rely heavily on brand entity recognition and semantic authority – how often your brand is mentioned, recommended and discussed across the web – to determine which sources to surface. Your AI visibility is a leading indicator of your brand’s broader digital authority.
How to track it: AI visibility tracking is a easy with JetOctopus – simply filter out GSC data by search query lenght and 0 clicks and explore the real intents of your users. If they’re comparing you to a competitor or struggling with your product – you’ll know it and will be able to use the information to strenghten your SEO and AI visibility.
Tools like JetOctopus complement AI visibility tracking by identifying which pages on your site carry the highest crawl and authority signals – helping you understand which content is most likely to be surfaced by AI engines.
SEO KPI Reporting: How to Present Results to Stakeholders
Tracking your SEO KPIs is only half the equation. The other half is communicating them effectively to the people who control budgets and make strategic decisions. Poor SEO KPI reporting is one of the most common reasons SEO teams struggle to secure investment – even when their results are strong.
Reporting Cadence
Different KPIs operate on different timeframes and should be reported accordingly:
- Weekly: Organic traffic trends, crawl coverage (JetOctopus dashboards), indexation alerts, backlink changes and any anomalies detected in server logs.
- Monthly: Organic conversions, CTR, non-branded traffic growth, search visibility, user engagement metrics and Crawl Budget Efficiency. Monthly reports are the core operational reporting layer for most SEO teams.
- Quarterly: SEO ROI, Organic CPA, CLV from organic, year-over-year visibility trends and strategic recommendations. Quarterly reports are what you bring to the CFO, CMO or board.
What to Include in an SEO KPI Report
An effective SEO KPI report tells a story. It does not just dump data – it explains what happened, why it happened and what will be done about it. A strong monthly SEO KPI report should include:
- Executive summary (3–5 sentences, written in business language, not SEO jargon)
- Period-over-period performance for each core KPI
- Context for any significant changes (algorithm updates, seasonal trends, competitor moves)
- One or two specific wins tied to SEO actions taken in the period
- Recommended actions or next priorities based on the data
Tools for SEO KPI Dashboards
The best KPI reports combine multiple data sources into a single clear view:
- JetOctopus: For technical crawl KPIs. JetOctopus’s visualization dashboards make it straightforward to present Crawl Budget Efficiency, bot hit distribution and indexation rates to non-technical stakeholders without requiring them to interpret raw log data.
- Google Looker Studio: Free, flexible dashboarding that connects GA4, GSC and other data sources into a single branded report.
- GA4: For organic conversions, CPA calculations, engagement metrics and revenue attribution.
Frequently Asked Questions: SEO KPIs
What is the difference between SEO KPIs and SEO metrics?
SEO metrics are granular, diagnostic data points – things like page crawl depth, Core Web Vitals scores, keyword rankings or bounce rate. They tell you what is happening technically or behaviorally on your site. SEO KPIs are a higher-order layer: they are the select metrics that connect SEO activity directly to business goals. Every SEO KPI is a metric, but not every metric qualifies as a KPI.
How many SEO KPIs should I track?
Less is more. Most SEO teams are better served by tracking 5–8 core KPIs with discipline than by monitoring 20 loosely defined metrics. A good starting set: Organic Traffic Volume, Organic Conversions, Search Visibility, SEO ROI and Technical Crawl Efficiency. Add Backlinks, CTR, CLV and User Engagement as your program matures.
How often should I report SEO KPIs?
Monthly reporting is the standard cadence for most operational SEO KPIs. Quarterly reporting should focus on financial metrics like ROI, CPA and CLV, as these require longer time windows to show meaningful signals. Weekly monitoring – particularly for technical KPIs like Crawl Budget Efficiency tracked through tools like JetOctopus – helps catch issues before they compound.
What SEO KPIs should I report to executives or clients?
Lead with Organic Traffic Growth, Organic Conversions and SEO ROI. Support these with Search Visibility to show market share context and Organic CPA to demonstrate efficiency. Save technical KPIs like Crawl Budget Efficiency for audiences who understand their operational significance – or translate them into business language: e.g., ‘27% more Googlebot visits to our product pages after architecture changes, unlocking X newly indexed URLs and a Y% traffic increase.’
Conclusion: Move From Metrics to Business Intelligence
The most successful SEO teams are not the ones tracking the most data. They are the ones tracking the right data and communicating it in a way that drives decisions. By anchoring your SEO program around Organic Traffic, Conversions, Search Visibility, ROI, CPA and Technical Crawl Efficiency – and reporting them with the discipline described above – you shift SEO from a tactical function to a core growth channel.
Foundational KPIs like organic CTR and keyword rankings complete the picture by giving you the diagnostic layer to understand why your top-line numbers are moving. Advanced KPIs like CLV from organic and AI Search Visibility ensure you are measuring the long-term and forward-looking dimensions of your organic program.
Technical KPIs like Crawl Budget Efficiency are often the most undertracked but highest-leverage lever available – especially for large or complex sites where wasted crawl activity is silently suppressing your best pages. If your team is not currently tracking how search bots move through your site, that is the highest-ROI place to start.