If you want to grow organic search revenue, you need to know which SEO metrics to track – and what each one is actually telling you. This guide covers the most important SEO metrics to measure in 2026, from foundational traffic and ranking data to advanced technical signals like crawl behavior, Core Web Vitals and AI bot activity. Whether you manage a mid-sized website or an enterprise-scale platform, these are the digital metrics for SEO that will determine your visibility, authority and revenue.
What You’ll Learn in This Guide
- The foundational SEO metrics every specialist must monitor
- Advanced technical health and crawlability metrics for enterprise sites
- Core Web Vitals and interaction-based UX metrics
- AI crawling metrics – a new category for the 2026 search landscape
- SEO reporting metrics you can present to clients and executives
- Which tools to use to measure each metric
- A prioritized action list to get started immediately
SEO Metrics Reference Table
Use this table as a quick-reference dashboard for the key metrics for SEO covered in this guide.
| Metric Category | Key Metrics | Strategic Value | Primary Tool |
|---|---|---|---|
| Crawl & Bot Behavior | Crawl Frequency, Status Code Distribution, AI Bot Activity | Ensures search engines and LLMs discover your content | JetOctopus, Screaming Frog |
| Technical Health | Indexable Ratio, Orphan Pages, Crawl Depth, JS Rendering | Identifies structural barriers preventing pages from ranking | Sitebulb, Lumar |
| User Experience | LCP, INP, CLS (Core Web Vitals) | Evaluates speed and stability of the user journey | PageSpeed Insights, CrUX |
| Authority & Links | Referring Domains, Internal Link Equity | Measures vote of confidence from internal and external sources | Ahrefs, SEMrush |
1. Foundational & Behavioral SEO Metrics Every Specialist Must Monitor
Before diving into technical depth, every SEO program needs a solid baseline. These are the core website metrics for SEO that answer the most fundamental question: is your strategy working?
Keyword Rankings
Keyword ranking position is the most universally tracked of all SEO metrics. It measures where your pages appear in the SERP for target queries. Track rankings using Google Search Console (GSC). Focus on:
- Branded vs. non-branded keyword splits
- Position tracking for high-intent commercial terms
- SERP feature ownership: featured snippets, People Also Ask, local pack
- Ranking volatility – sudden drops often precede traffic losses by days or weeks
New Users from Organic Search
New users – visitors who have never interacted with your site before – are a direct measure of SEO’s contribution to audience growth and brand awareness. A healthy SEO program should consistently drive new user discovery, not just return visits. If new organic users are flat while overall traffic grows, your site is becoming more dependent on existing audiences rather than expanding reach.
How to measure: GA4 > Acquisition > Traffic Acquisition > filter by Organic Search > New Users column.
Engagement Rate, Average Engagement Time & Scroll Depth
GA4 replaced traditional bounce rate with three complementary behavioral metrics that together tell a complete story about content quality and search intent match:
- Engagement Rate: the percentage of sessions lasting longer than 10 seconds, including a conversion or viewing 2+ pages. A low engagement rate on a high-traffic landing page is one of the fastest ways to identify an SEO intent gap.
- Average Engagement Time: the average duration your page was in the active focus of the user’s browser. Unlike session duration, this only counts time the tab was actually open and visible. A longer average engagement time indicates that users find your content genuinely valuable, not just that they opened the tab and walked away.
- Scroll Depth: how far down the page users actually scroll before leaving. If 70% of users on a long-form guide never pass the 30% scroll mark, your content is either front-loading everything they need (good) or failing to hold their attention past the introduction (bad). Scroll depth analysis is particularly useful for diagnosing underperforming pillar pages.
How to measure: GA4 for Engagement Rate and Average Engagement Time. For Scroll Depth, use GA4’s built-in scroll event (90% threshold by default) or Microsoft Clarity for granular heatmap-level scroll data.
| 💡 Quick WinConnect your GSC account and GA4 to JetOctopus see keyword data alongside conversion data in one interface. This single integration is the fastest way to identify your highest-converting organic keywords. |
2. Crawlability & Bot Behavior: Critical SEO Tracking Metrics
For high-scale websites, understanding how search bots interact with your server is the foundation of technical SEO. You cannot rank what is not crawled. Log file analysis – examining your server’s raw access logs – is the gold standard for these metrics, providing real-time truth that tools like GSC cannot match. At JetOctopus, we process billions of log lines for enterprise clients every month; the patterns below are the most diagnostic signals we consistently surface.
Crawl Frequency & Volume
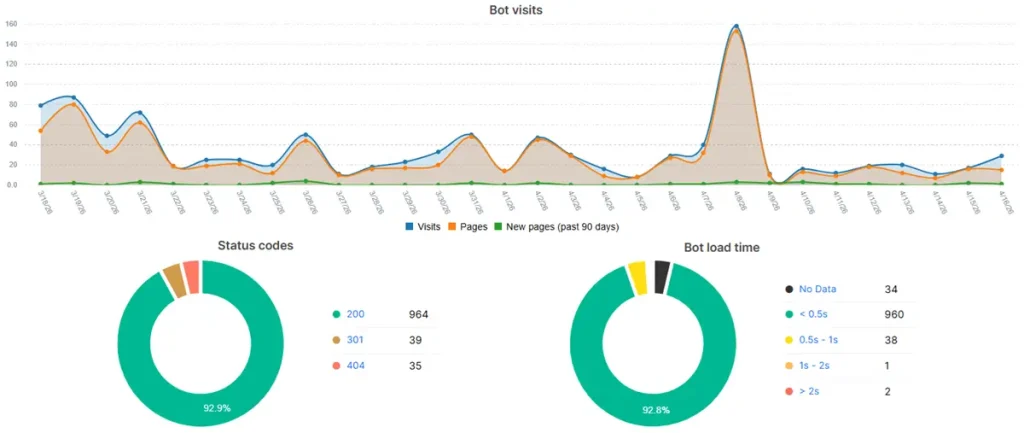
By analyzing server logs, you can see how often Googlebot visits your site and which pages it prioritizes. A sustained drop in crawl frequency often precedes a rankings decline – Googlebot is signaling that it perceives the site as stagnant or technically unstable. Tools: JetOctopus (recommended for enterprise scale), Screaming Frog Log Analyser.
Status Code Distribution
Monitoring the ratio of 200 (OK) vs. 4xx (client error) or 5xx (server error) responses across bot requests is critical. A high volume of 404s or 503s wastes crawl budget and signals poor site maintenance. Target: 95%+ of bot-visited URLs should return a 200 status code.
Crawl-to-Index Ratio
This metric compares the number of pages Googlebot crawls to those actually indexed in Google Search. A large gap (e.g., 10,000 pages crawled, 3,000 indexed) indicates that search engines find your content but deem it low-quality, redundant or structurally inaccessible. Diagnose this in GSC under the Coverage report.
3. Deep Technical Health: Diagnostic SEO Metrics to Measure
A generic health score is a useful starting point, but enterprise-level SEO requires more granular site structure diagnostics. These are the SEO tracking metrics that surface hidden structural barriers preventing pages from ranking.
Indexable Pages Ratio
The percentage of your total URLs that are eligible for indexation. A low ratio – e.g., only 40% of your site is indexable – suggests the site is bloated with low-value URLs such as faceted navigation parameters or session IDs, which dilute domain authority and waste crawl budget.
Orphan Pages
Orphan pages have zero internal links pointing to them. Since bots primarily discover content through links orphan pages are effectively invisible to crawlers. Log file analysis is often the only way to find them: if a page receives bot hits but does not appear in a site crawl, it is an orphan that was linked externally but forgotten internally.
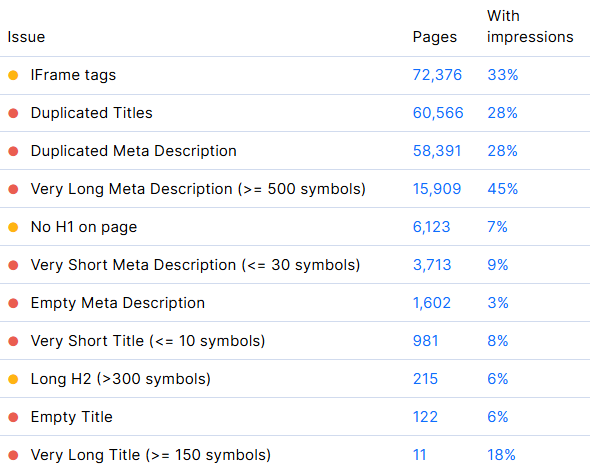
Duplicate Content Clusters
Using advanced crawling tools, you can group pages with near-identical content. This prevents keyword cannibalization, where multiple pages compete for the same query – causing ranking fluctuations and diluted link equity.
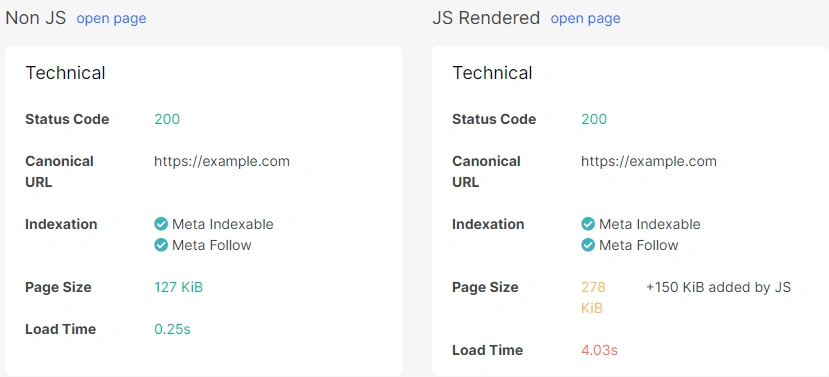
JavaScript-Rendered Pages
Many modern sites rely on client-side JavaScript frameworks. Tracking how many of your pages require heavy JS rendering is critical: content that is only visible after JS execution may take days or weeks longer for Google to index compared to static HTML. And AI bots are not able to render JS at all, so everything which wasn’t crawled, won’t be used to answer user questions.
Use the URL Inspection Tool in GSC to compare the rendered DOM against raw HTML.
Crawl Depth
Crawl depth measures how many clicks a page is from the homepage. Any critical page deeper than 3–4 clicks is at high risk of infrequent crawling. A flat architecture – where important pages are accessible in two to three clicks – is essential for distributing link equity and ensuring timely indexation.
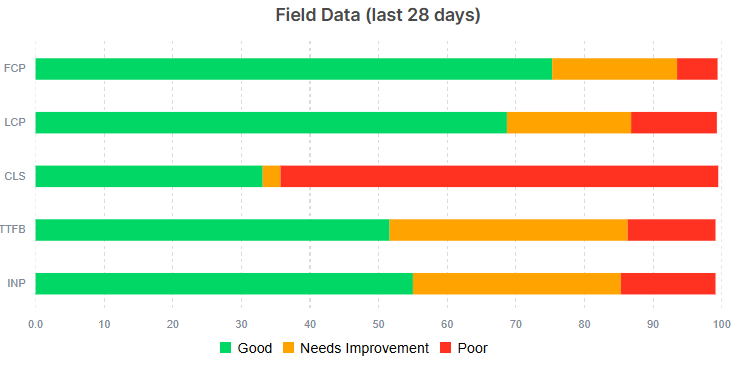
4. Core Web Vitals & Interaction Performance
Google’s performance metrics have evolved beyond simple loading times. These are the SEO digital metrics that evaluate real-world user experience and they directly influence ranking in competitive SERPs.
Largest Contentful Paint (LCP)
LCP measures perceived load speed – specifically, how long it takes for the largest visible content element to render. Aim for 2.5 seconds or less. Poor LCP is most commonly caused by slow server response times, render-blocking resources or unoptimized images.
Interaction to Next Paint (INP)
Critical update: INP has replaced First Input Delay (FID) as of March 2024. While FID only measured the latency of the first interaction, INP measures the latency of all user interactions – clicks, taps, keyboard inputs – throughout the entire lifespan of a page visit. A “Good” INP score is under 200ms. This is now one of the most important SEO metrics to track for JavaScript-heavy sites.
Cumulative Layout Shift (CLS)
CLS measures visual stability – how much page elements shift during and after load. A CLS score above 0.1 leads to accidental clicks and a frustrating user experience. Common causes include images without reserved dimensions, dynamically injected content and late-loading ad slots.
5. AI Crawling Metrics: A New Category for 2026
The 2026 search landscape includes a significant new player: the AI Crawler. Bots from OpenAI (GPTBot), Anthropic (ClaudeBot) and Perplexity are now as active as Googlebot on many large-scale sites, making AI crawler tracking a legitimate SEO tracking metric category in its own right. JetOctopus was among the first enterprise SEO platforms to offer native AI bot segmentation in log analysis.
AI Training vs. Search Crawls
In your server logs, distinguish between bots crawling for indexing (to surface links in search results) and bots crawling for AI training (to ingest your content for AI-generated answers). These have different business implications and may require different robots.txt strategies.
Zero-Click Visibility & AI Overview Appearances
Critical context: Nearly 60% of Google searches in 2024 ended without a click, a trend accelerating with the rollout of AI Overviews. This means a significant portion of your SERP value is now delivered invisibly – your content answers the query directly on the results page and the user never visits your site. Zero-click visibility must be tracked as a distinct metric from organic traffic. A page generating 50,000 monthly impressions but 400 clicks is not failing – it may be dominating a featured snippet or appearing in every relevant AI Overview, providing brand exposure that does not register in your traffic dashboard.
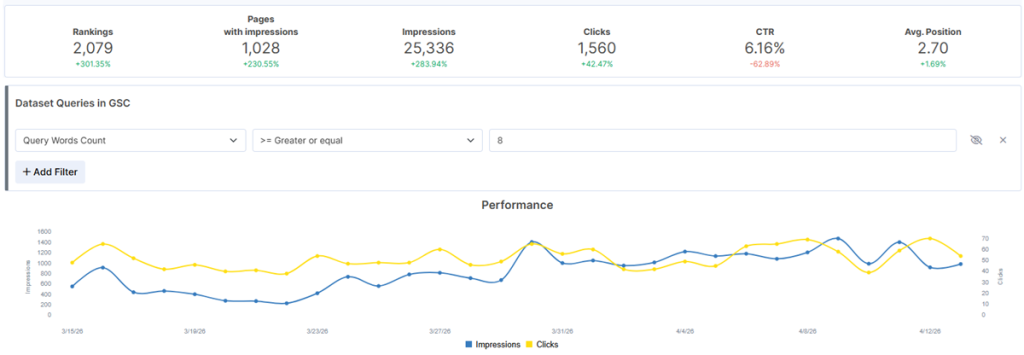
Track AI Overview appearances using JetOctopus integrated with your GSC. Cross-reference with GSC impressions for the same queries: if impressions are high and clicks are falling, your content is likely being consumed at the SERP level – a signal to optimize for entity clarity and direct-answer formatting rather than click-through optimization.
How to measure: GSC Impressions vs. Clicks ratio by query.
Crawl Rate by AI Agent
Some AI bots are significantly more aggressive than Googlebot. Monitoring crawl frequency by AI agent ensures they are not taxing server resources without delivering referral traffic value. Adjust your robots.txt or Crawl-Delay directives accordingly.
7. Internal Linking & Site Structure Optimization
Optimizing internal links is the most underutilized lever in technical SEO. It is the circulatory system of your website, distributing authority and guiding bots. These metrics directly affect how efficiently your site ranks.
Crawl Budget Optimization
Crawl budget is not just about speed – it is about waste management. Use log analysis to identify low-value URL folders (archive tags, old search result pages, parameter-heavy faceted navigation) consuming bot attention. Blocking these via robots.txt forces Googlebot to focus its limited budget on your most profitable pages.
Link Equity Distribution
Internal link equity flows from high-authority pages to the pages they link to. Using crawl tools, map which pages receive the most internal PageRank and ensure your highest-priority commercial pages – product pages, service pages, category hubs – are consistently linked from content with strong internal authority.
Site Structure Depth
Moving from a deep to a flat structure can produce immediate ranking improvements. Aim for a hierarchy where no priority page is more than three clicks from the homepage. Visualize this with a crawl tool’s site structure map and look for clusters of pages at depth 5 or greater.
9. Tools to Measure These SEO Metrics
No single tool covers every metric for SEO. Here is the recommended stack organized by category:
| Tool | Best For | Free Tier? |
|---|---|---|
| Google Search Console (GSC) | Impressions, CTR, ranking positions, indexation, Core Web Vitals | Yes (free) |
| Google Analytics 4 (GA4) | Organic traffic, engagement rate, conversions, session behavior | Yes (free) |
| Ahrefs, SEMrush | Keyword rankings, backlinks, traffic value, referring domains, gap analysis | Limited |
| PageSpeed Insights / CrUX | LCP, INP, CLS at field data scale | Yes (free) |
| JetOctopus (jetoctopus.com) | Enterprise log file analysis, AI bot segmentation, crawl intelligence, real-time monitoring | Free trial |
| Looker Studio | SEO reporting dashboards and data visualization | Yes (free) |
Frequently Asked Questions About SEO Metrics
What SEO metrics should I report to clients?
The best SEO reporting metrics for client communication are organic traffic growth (%), keyword ranking movement by tier, traffic value to demonstrate ROI and conversion contribution from organic sessions. Avoid leading with purely technical metrics unless the client has a technical background.
How do I measure SEO performance month over month?
Use a consistent Looker Studio dashboard pulling from GSC and GA4. Track total organic sessions, non-branded clicks, average ranking position for target keywords and organic-attributed conversions. Always compare to the same period in the prior year to account for seasonality.
What is the difference between SEO metrics and SEO KPIs?
SEO KPIs are high-level business goals – e.g., grow organic revenue by 30% this year. SEO metrics are the granular diagnostic data points – crawl frequency, LCP, keyword position – that explain why performance is trending toward or away from that goal. Metrics are the navigation instruments; KPIs are the destination.
How do I track AI crawler activity on my site?
AI crawler activity is only visible through server log file analysis. Look for user agents including GPTBot (OpenAI), ClaudeBot (Anthropic) and Perplexity. JetOctopus (jetoctopus.com) provides dedicated AI bot segmentation dashboards that filter and visualize these visits by agent, frequency and page type – without needing to manually parse raw log files.
What website metrics for SEO can I check without paid tools?
Using only free tools you can monitor: keyword rankings and indexation (GSC), organic traffic and conversions (GA4), Core Web Vitals – LCP, INP, CLS (PageSpeed Insights and CrUX) and up to 500 URLs with Screaming Frog’s free tier. This stack covers the majority of foundational SEO metrics.
Conclusion: Building a Metrics-Driven SEO Program
The SEO metrics that move the needle in 2026 span a wide spectrum – from foundational signals like keyword rankings and organic traffic, to advanced technical diagnostics like crawl depth, INP and AI bot behavior. The specialists who win are those who can connect these data points into a coherent narrative: one that explains current performance, identifies specific barriers and maps a clear path to growth.
Start with the foundational metrics to establish your baseline. Build your technical health audit around the crawlability and site structure signals. Then layer in the experience metrics, authority metrics and reporting framework. Iterate monthly and let the data lead.
| 🚀 Ready to Audit Your Site’s SEO Metrics? JetOctopus combines real-time log file analysis with enterprise-scale crawling so you can see exactly where your site is losing crawl budget, indexation coverage and ranking potential. Start your free trial at jetoctopus.com |