
Guide to creating alerts: tips that will help not miss any error
JetOctopus recently had a great update: the ability to configure alerts became available. All our clients can set up an unlimited number of alerts for free in 4 sections: logs, Google Search Console, Crawl and Core Web Vitals.
In this article, we will explain how alerts work, how to configure them, and show several examples from each section.
How alerts work
To configure alerts, go to a separate menu. On the “Overview” tab you will find a list of fired alerts and historical data. The “Fired Alerts” list will display those that did not fix.
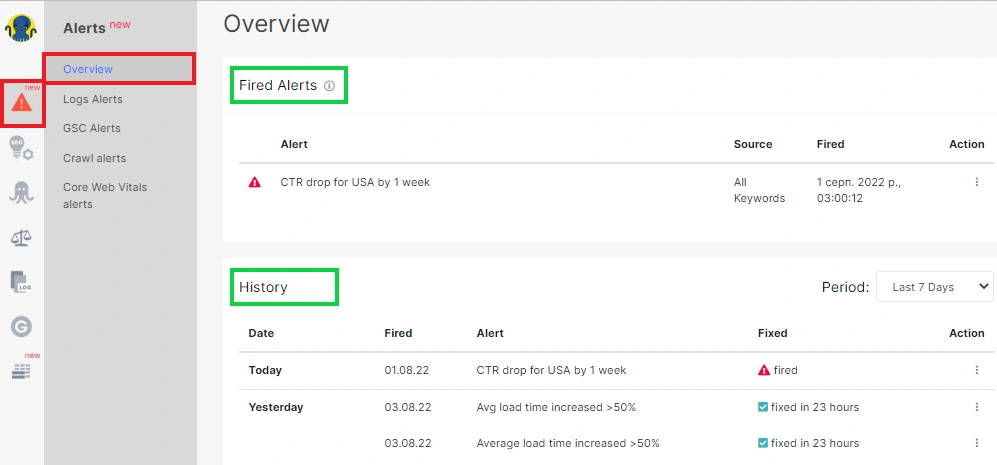
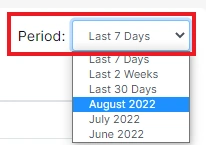
To view the history of alerts and check which ones have already been fixed, set the desired period.
You can block (mute), edit or view the alert settings directly in the “Overview” tab: click next to select the desired action.

Pay attention to the fact that logs and GSC alerts do not require additional crawls, as JetOctopus receives all this data in real-time from external sources – your web server and Google Search Console. Logs and data from the GSC are constantly updated, this is a live process.
However, scheduled crawls are required to set up crawl and core web vitals alerts. These scheduled crawls take your limits, so set them up carefully. You can use the URL list to save limits or check only the most important types of pages.
Each alert consists of only three steps.
Step 1. Configure conditions – configure here the data for which checks will take place. For example, select the types of pages you want to check regularly.

Step 2. Alert configuration – select the check interval and the condition under which the alert will be triggered. For example, if the number of pages selected in the first step increases by 50% in logs. To check whether the alert conditions are configured correctly, click the “Test Alert” button.

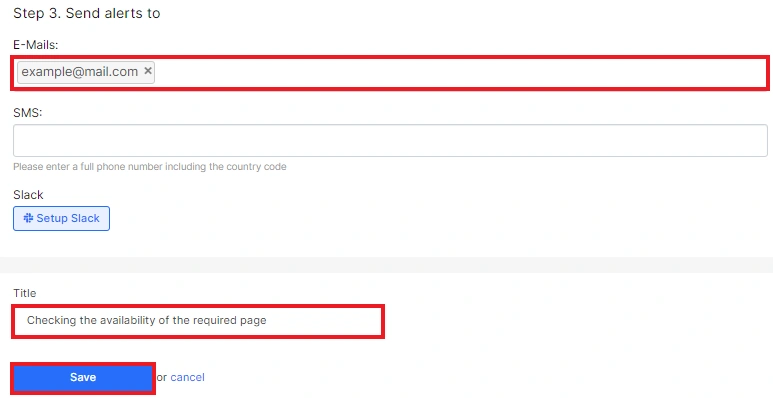
Step 3. Send alerts to – configure the sending of alerts. JetOctopus can send alerts to multiple emails or to Slack: so you can notify the whole team about detected problems. When choosing to send notification by SMS, remember to use the country code when entering the number.

Log Alerts: examples
To use log alerts, you need to integrate logs into JetOctopus. Unfortunately, notifications cannot be sent if you import log files manually.
Checking the availability of the required page
You can receive an alert if the desired page returns a non 200 response code to the search bot. It is extremely important to check the availability of the robots.txt file, sitemaps and pages that bring the most traffic. After all, if one of these pages is unavailable for scanning by bots, it can cause problems with crawling the website and discovering new pages. If the most important pages will return regularly with a non 200 response code, these pages may drop out from the SERP.
1. Go to the “Log Alerts” section and click “Create Alert”. Select “Raw logs” – this is the data table based on which the notification will be sent.

2. Select the desired search engine and the desired domain. Next, select the desired URLs to check. You can use a regex or a list of exact URLs.
Also configure a second filter: URLs should not return a 200 status code.
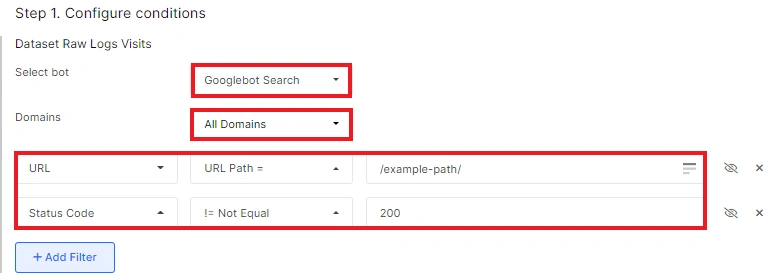
3. Configure the interval and condition. If you select Rows count – Current count – > Greater than – 0, this will mean that you will receive notifications when at least one of the URLs selected above returns the status code selected in the first step.

4. Configure the mails or phones or Slack where the alerts will be sent.
5. Name your alert so that you understand what is being checked. This makes it easy for you to navigate the list of alerts.
You can set up alerts for any status codes, pages and robots. You will find many examples in this video.
Alert for increasing 404 status codes in logs
Monitoring unavailable pages in logs is a very necessary option for all SEO specialists. You can get notified if the number of 404, 5xx, 403, 304, etc. in logs increases.
1. Select a search engine and domain. Next, filter the desired status code – = Equals – 404. This means that JetOctopus will check the presence of 404 URLs in the “Raw Logs” data table.

2. Configure the check interval. And select a condition. For example, you can receive a notification every hour if the number of new 404 URLs (those that were not in the logs in the previous period) increases by 10%.

3. Adjust the conditions for sending and the title of your alert.
Examples of crawl alerts
To receive crawl alerts, you need to set up a regular scheduled crawl. Note that this is how the limits will be used.
Click the “Create a crawl schedule” button and configure the crawl. You can use a URL list or set a page limit in order not to crawl the entire website every time.
More information: How to set up a scheduled crawl.

Next, proceed to create the desired alerts.
Click “Create alert” and select the desired data table based on which notifications will be sent.

Checking the number of <meta name=”robots”> elements on the page
Two or more <meta robots> create a conflicting signal for search bots, so the bots will use a more prohibitive rule.
1. Select the “Pages” data table. In the first step, select <meta name=”robots”> count – greater than 1.
2. In the second item, select Rows count – Current count – > Greater than – 0.
This will mean that if even one page (the one you set up in step 2) has more than one <meta robots> element, you will be notified.
Alert when duplicate titles increase
To receive an alert if duplicate titles have increased on your website, select the Pages data table. Next, select Titles Duplicated Count – > Greater than – 0.
In the second block, select Rows count – Current count – Increased more than % – 50% (or any you need).
Google Search Console Alerts
To receive GSC alerts, you need to connect to the Google Search Console. You can create alerts based on Cannibalization and Keywords datasets. Please also note that the data will not appear immediately. Google Search Console contains up-to-date data with a lag of two days.
What alerts can be created:
- if our most important pages will drop out of the index;
- if the positions of the most trafficked pages fell below 3;
- if CTR/clicks/impressions have decreased in the needed country;
- CTR/clicks/impressions for branded commercial queries have decreased.
Alerts can be received not only when something undesirable happens. You can set up alerts that JetOctopus will send you if the desired goals are achieved:
- CTR/clicks/impressions will be better;
- for a group of pages in split testing, the number of impressions will increase or the average position will become higher than 3;
- the number of pages in SERP will increase by 100%, etc.
Core Web Vitals Alerts
In order to receive notifications if Core Web Vitals metrics change, you need to create a CWV schedule.

Prepare URLs for which you want to check metrics and select the type of device.
You can then set up an alert and be notified if FCP or LCP or other metrics change.
Note the fact that FCP and LCP are measured in seconds, and the first input delay and CLS are in milliseconds.
Also, when setting up core web vitals alerts, pay attention to the data type: field or lab. If this is field data, remember that it shows the last 28 days. If the developers made a release to improve CLS, then use lab data to see the result. And field data will show just average data. And after 28 days you will be able to see a clean result.
And video about basic alert settings:
And one more cool one with use cases:

