
How to check JS website with JetOctopus
JavaScript is fast, dynamic technology. It saves your server resources which is a great benefit for you. However, in order for the JavaScript site to generate a lot of organic traffic, you need to be careful about the settings and auditing of SEO. In this article, we will explain how to audit JS websites with JetOctopus and what you need to check to make your JS website search engine friendly.
Step 1. Start a new JS crawl or select it from the crawl list.
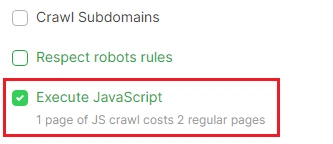
If the “JavaScript Performance” report is not available for the selected crawl you need to start a new crawl with the execution of JavaScript. Activate the “Execute JavaScript” checkbox in a “Basic settings”. Pay attention to pricing: 1 page of JS crawl costs 2 regular pages.
Then make all the other settings of your crawl and start the crawl.
More information: “How to configure a crawl of your website”.
How to set up crawling of JS websites
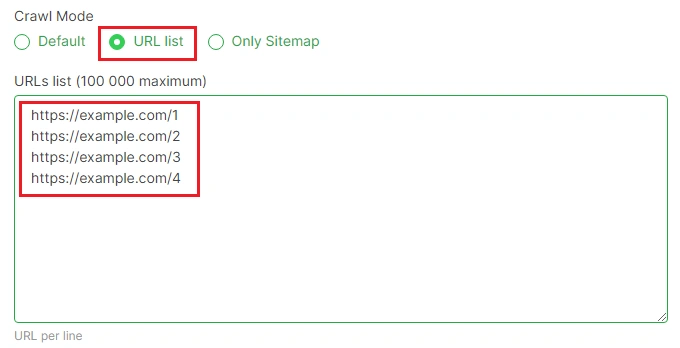
If you have a limited budget, you can use URL mode. You can create a list of the most important pages of your website. For example, 10 thousand product cards, 100 categories, 1000 filtering, infopages, blog articles, promotions, etc. Usually, JavaScript errors are the same for each type of page. And when you find these errors, you can scale it to all the other pages of this type.
If you select the “URL list” crawl mode, JetOctopus will scan only urls from your list.
Step 2. Wait for the crawl to finish.
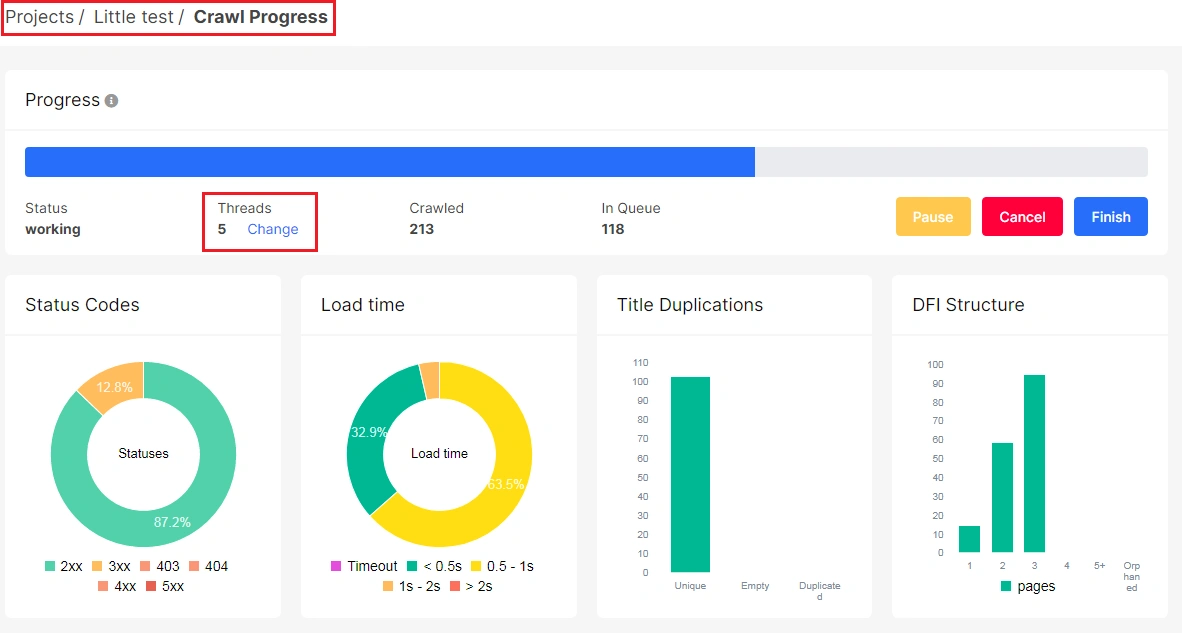
You can see the crawl’s progress by clicking on its title. Crawling with JavaScript execution usually takes more time. You can increase the number of threads on a page that shows crawl progress if you are sure that your site is good with a high load.
Step 3. Analyze JavaScript performance.
After the crawling is finished, go to the “JavaScript performance” report.
In the “Load Time” report you can see four indicators:
- the First Paint – the time when the browser displayed the first pixel on the screen;
- the First Contentful Paint – shows the time from the crawler’s query to the first displaying of a certain element; for example, it can be a displaying of text or an image;
- Page Loaded – when the content of the page was displayed on the screen completely;
- All Requests Completed – when all processes on the page have been completed. It often happens that the page is visually loaded and the user can interact with it. But in fact, the JavaScript is still running, or, for example, analytics code is working. For the user it is ok. But search engines don’t know that some JavaScript doesn’t matter, so they are waiting for the finish of all processes.

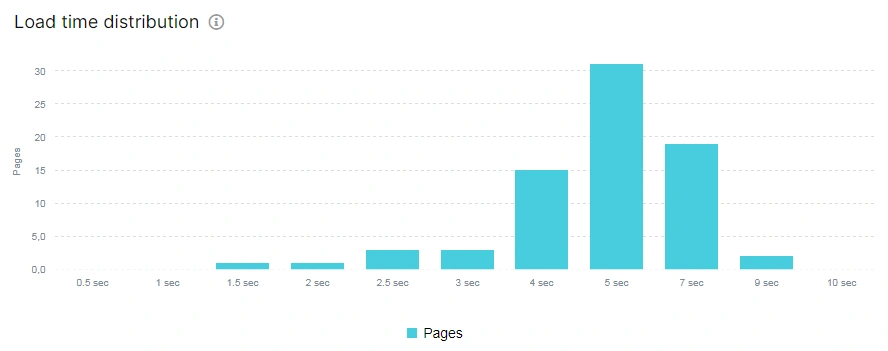
Below you can see the “Load time distribution” report which shows how many pages are fast and how many pages are slow. If you click on the column, you will go to the data table where you can analyze slow pages with more detail.
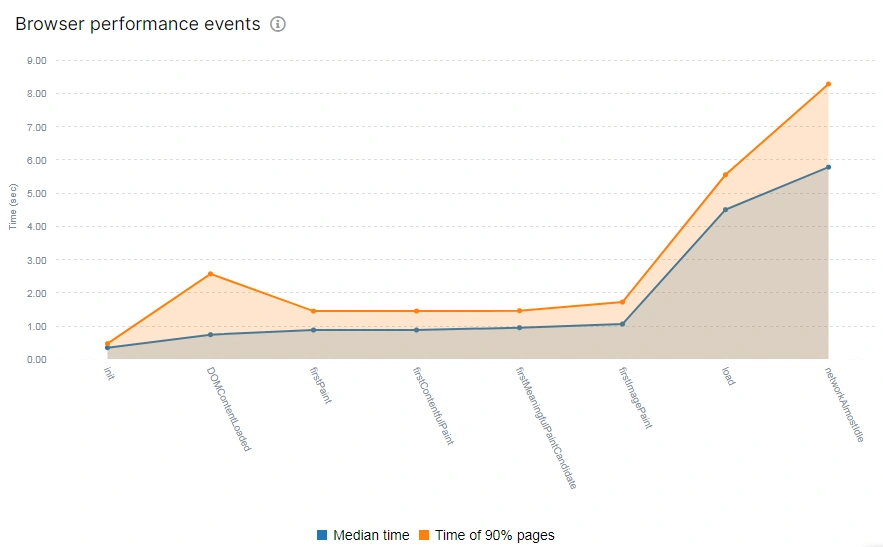
On the “Browser performance events” chart, you can see information about the time of lifecycle events when loading JS pages. For example, you can see the median of DOM loading, first paint, first image paint, etc. With the help of this chart you can determine which elements of the page are the slowest to load.
Step 4. Analyze JS errors.
Go to the “JS performance” report, then select the “JS errors” report. Here you can see a list of all the errors of the JS console. These are the errors our crawler received while crawling your JS website. You will go to the data table with a list of all pages with an error, if you click on the number in the “Pages count” column next to a specific error.

It is likely that search engines also receive such errors. You can check if the GoogleBot received the same error by using the URL testing tool in Google Search Console. Go to the testing tool in Search Console or use Mobile Friendly Test. Next, check the URL. View tested page – “More info” – “JavaScript console messages” – type “Error”.
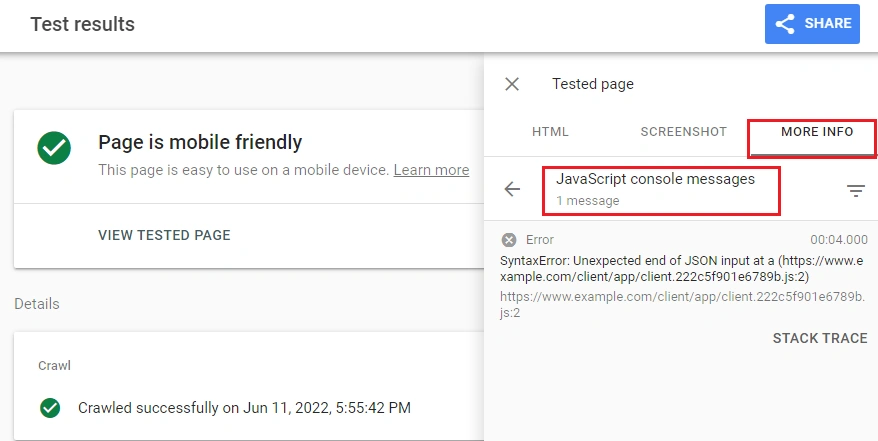
JS console errors indicate that your JS Website failed when executing JS and some code is not working properly.
Step 5. Compare JavaScript and regular HTML content
The “JS vs HTML” report is very important. This report is a comparison of JavaScript and regular HTML content. JetOctopus compares all page code, not only basic textual content.
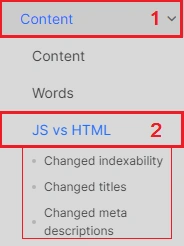
If there is a big difference between the original source code of the page and the rendered page, this may indicate problems with JavaScript (or with server-side rendering). Also, a large discrepancy in the code can be considered as a cloaking. If you click on any segment of the chart, you will go to the data table. Here you can see a list of pages with the problem.
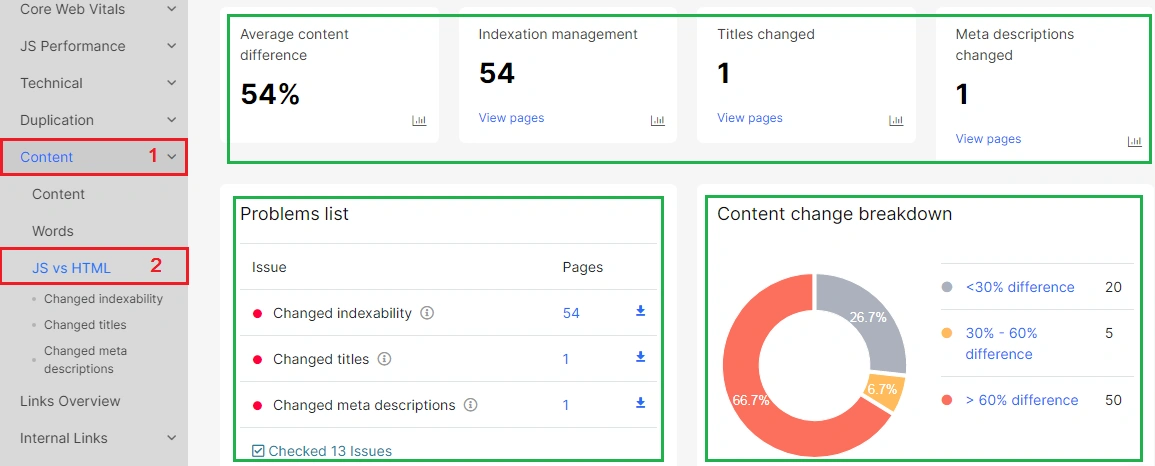
Be sure to check what is the difference between the regular HTML and the JavaScript version. JetOctopus highlighted the most important elements in separate reports:
- Changed indexability;
- Changed titles;
- Changed meta descriptions.
“Changed indexability” report shows indexing rules that have changed after JavaScript processing. If the regular HTML version has noindex meta robots or X-Robot-Tags, then the search engine will not index your page, even if the JavaScript version has an index, follow. Your page will not be included in search results. Why? Because search engines always choose more restrictive rules.

Another important point is checking changed titles in the “Changed titles” report. Very often the regular HTML version uses the same titles for the whole site. And after rendering JavaScript changes titles to unique for each page. In this case, the search engine will primarily rank the page by the title which was found in the regular HTML version.

The “Changed meta descriptions” report shows which descriptions differ in JS and regular HTML.

Step 6. Check other important SEO elements.
What else is important to check when you compare regular HTML and JavaScript code? We recommend to check all important SEO elements:
- titles;
- meta-data;
- headings;
- canonicals;
- indexing rules;
- hreflangs;
- main textual content like a category SEO-texts;
- availability of internal links.
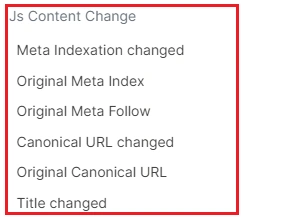
JetOctopus checks most of these elements. Go to the “Data tables” – “Pages”, select the needed element in “JavaScript Content change” breakdown filter, and apply. For example, check the canonicals. They must be the same both on JS and HTML versions.
In addition to the specific audits we described above, you should also check the standard issues:
- canonical settings;
- indexing rules;
- uniqueness of content;
- availability of links, etc.
To check for links, go to “Data Tables” – “Pages”. If you do not see in the data table all the pages of your website, it means that there were no links to those pages in the code. These pages may appear in the code after the visitor has performed an action. For example, when the visitor clicks on the category menu. GoogleBot cannot find and scan such links. So make sure all your links are in the rendered code with <a href=>.

