
How to explain to your clients all about SEO technical reports like a pro
In this article, we’ll talk about how to help non-SEOs understand all the dashboards, reports, and audits. In our work with SEO, we use a lot of data and visualizations, which can be unclear for your client or your boss if they do not have an SEO background. And a proper understanding of all this data will help explain what is happening with your website.
Since JetOctopus also uses a lot of visualizations and dashboards, we will explain using examples from JetOctopus.
What is a technical SEO report
SEO report is a visualization, data table or dashboard that describes a certain metric or shows results in Google. For example, the “Countries” data table in Google Search Console section will show the results of your website in organic search in different countries. The results can be both negative and positive. And the “Overview” dashboard in the “Crawl” section will show the technical status of your website and the technical issues that need to be fixed.
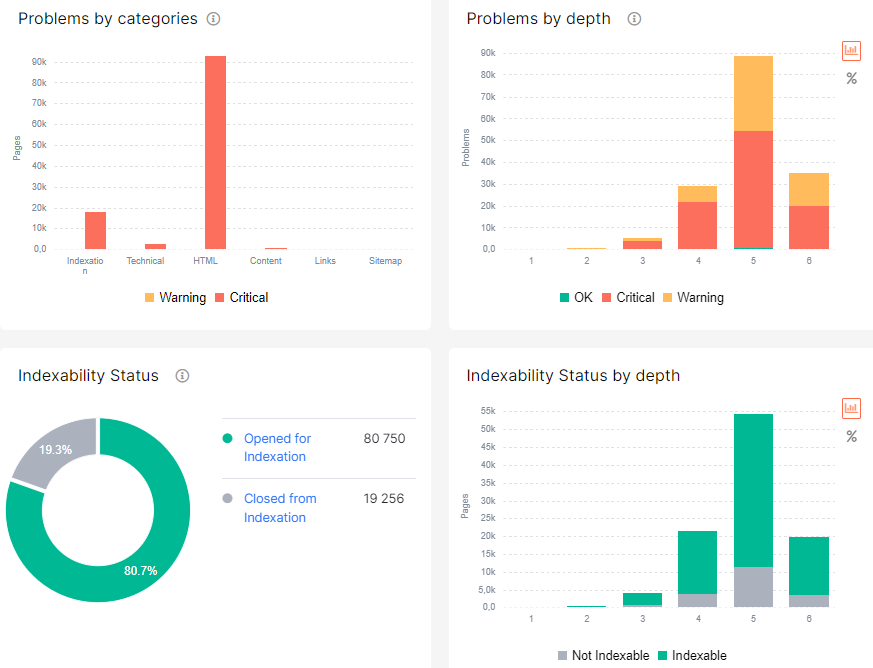
In general, all data in JetOctopus can be divided into three parts:
- raw data – crawling results, search engine logs, data from Google Search Console, etc.;
- data tables with problematic pages – for example, lost and new keywords, blinking status codes, 404 status codes, etc.; in these data tables, we have highlighted all the pages that have a certain problem or that have achieved the desired result;
- visualizations – each section in JetOctopus has many convenient dashboards and visualizations that simplify the analysis of raw data; agree that it is much more convenient to understand the issue scale using a chart than to manually count it in Excel, especially if your website has millions of pages.
All this data is available to our customers, so you can easily use all this information to create reports.
And based on the collected data, you can make conclusions.
By the way, JetOctopus can also offer you some of its conclusions. In particular, on the “Deep Impact” dashboard, you will see data on the factors that most affect the effectiveness of your website. These graphs are built by artificial intelligence. And it will be different for every website.
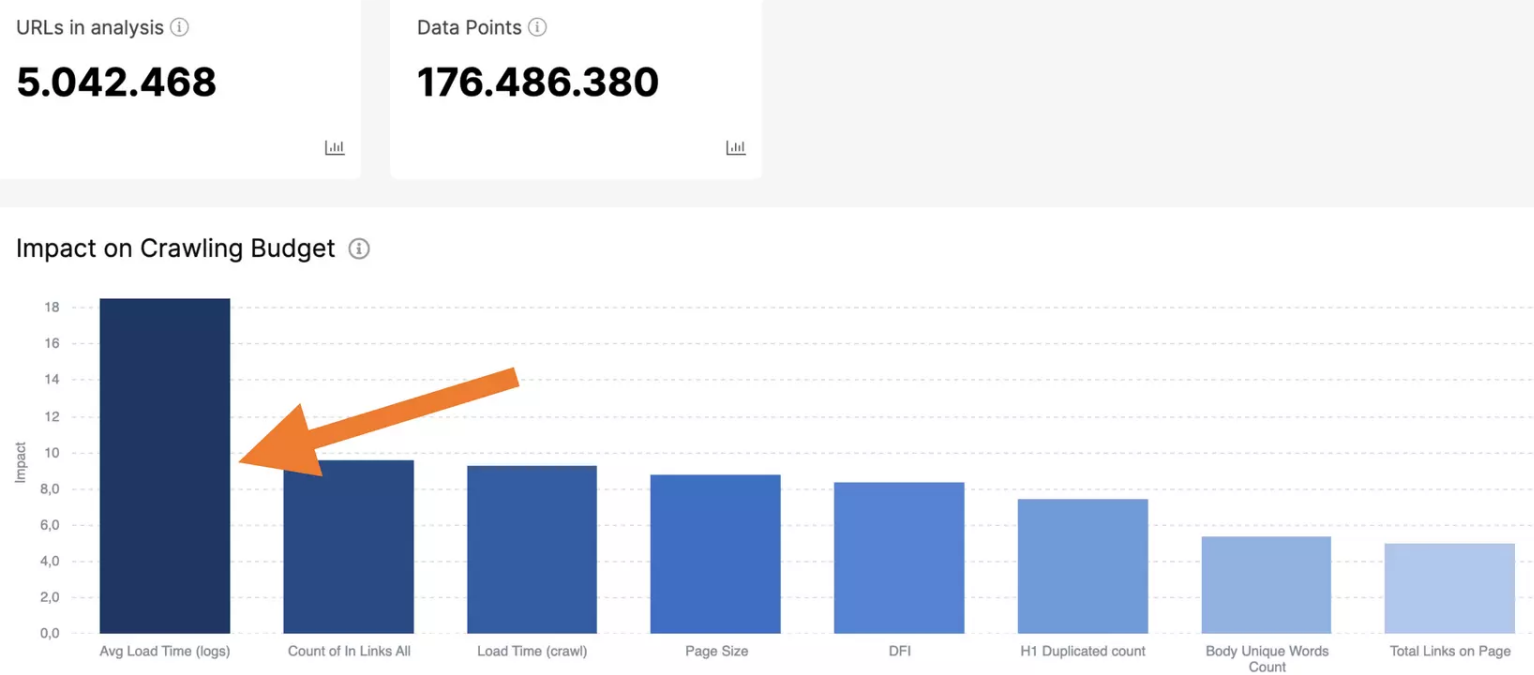
A key step in explaining technical reports is emphasizing the correct conclusions. It is important for the client to understand that not all “red” charts indicate low quality SEO optimization or potential search problems. For example, duplicated titles and meta descriptions are not a problem as long as all pages with duplicate titles and meta descriptions are non-indexable and closed from crawling.
Pay attention to terminology and key metrics
Before you start explaining the next steps for SEO optimization, make clear to your clients the basic terminology and key metrics used in SEO reports. Then your reports will be more understandable.
Crawling – what is crawling, what data does it collect, why crawling results differ. This is extremely important, because most websites are dynamic and some kind of changes happen regularly on these websites.
Logs – many customers may view logs as information about users who have visited a website. However, SEO specialists are primarily interested in search engine logs. Therefore, pay attention to the fact that the logs show whether the search engine found the needed page. If Google has not visited this page, it will not be able to show it in SERP. As a result, the user will not be able to go to the site and make a conversion.
Status code – we advise you to pay attention to the status code and what it is. After all, status codes are an important indicator of site health, just like website performance and speed. If your website has a lot of 404 or 5xx status codes, then not only search engines, but also users will not be able to get content and use your website.
Page load speed, load time, Core Web Vitals – if the website is slow, users will leave it. We hope your client understands that today’s users want to interact with the website as quickly as possible, and poor performance has a bad effect on the bounce rate. Search engines, in turn, want to show their users satisfying websites. As a consequence, slow sites will rank lower.
Impressions, clicks, position, keywords are also important terms for SEO optimization. The average position may be low if you consider it for all countries and for all keywords. But if you highlight the target country and target keywords, the situation can be radically better. Therefore, it is important to clarify here that one metric cannot be a key indicator.
Please highlight to your client that there are different sources of data: a crawl; logs that show the activity of search robots; Google Search Console and Google Analytics, which show search and user interaction data. Clarity of how site health affects users behavior. For example, users see a meta description in a snippet. And the site’s clickability depends on the attractiveness and relevance of this meta-description.
Explain the current situation and KPI
As non-SEO experts, your clients may sometimes pay attention to other performance metrics. Therefore, try to emphasize those metrics that are most indicative at this stage of the site’s activity.
As we know, in order to get a conversion, a page has to go through a publication, search bot’s crawling, indexing, ranking, and the last one in this funnel is a customer click. All these stages are gradual. And if you are currently working on the crawlability of the site, then conversions cannot be a key indicator.
The same with search results. First, your page should appear in SERP, and after a while, with good SEO optimization, you will get this page in the top 10, and then in the top 3. Therefore, at this stage, the key KPI for you may be ranking, and then CTR.
We recommend focusing on the idea that not all stages of SEO optimization can be clear and valuable to the client. Therefore, explain the importance of each stage of optimization and highlight the impact it will have on Google. After all, there are many tasks that are not visible to the user, but this will help search engines better discover and index your website. Another important step in understanding with the client is the explanation of the current situation. Even if the entire website is unindexable, all the content is duplicated, and search engines visit only pages with get parameters, this is not a reason for disappointment. Fix all issues and describe how these issues affect and what steps need to be taken to fix it.
How to show the results of SEO optimization to the client using SEO reports
As usual, the results of SEO optimization are the most important for your client.
We recommend starting with more general data in each section. For example, show how the frequency of crawling by search engines of your website has changed, which technical issues were fixed, and how many pages appeared in the SERP.
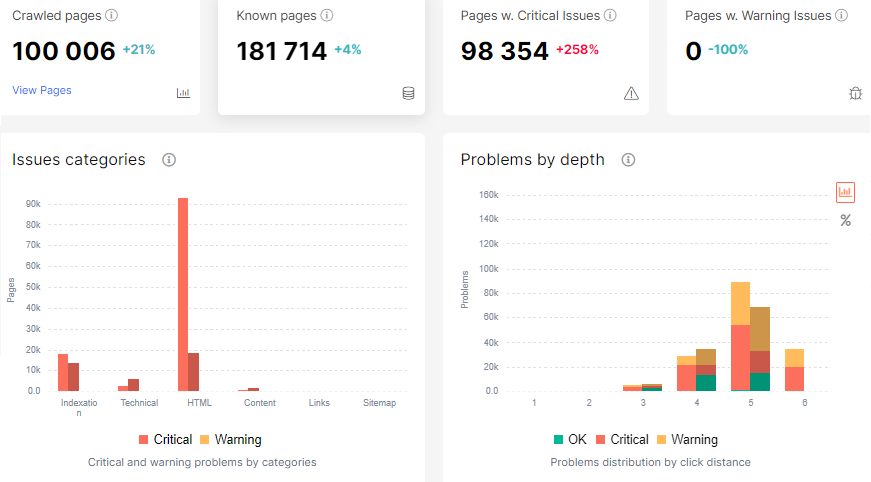
To compare the current situation and your results, we recommend using the “SEO Problems” dashboard for the first crawl and for the final crawl.

You can also use the crawl comparison – this is a powerful tool that will allow you not only to show the difference, but also to get ready-made visualizations with a comparison for two crawls.
More information: How To Compare Crawls
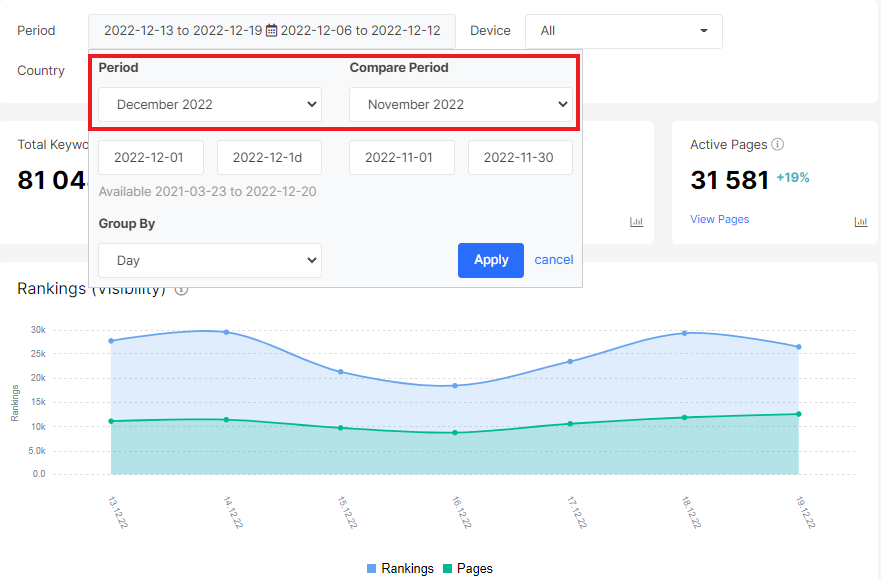
You can compare data in the Google Search Console section using the date settings.
One of our main recommendations is to fix the dates of the SEO tasks you have completed. For example, fix when changes were made to the robots.txt file and show the consequences of this change: how many pages the bot began to scan, how the ratio of useful and unnecessary pages in scanning changed and so on.
The same with internal optimization – show in comparison the data before the start of optimization and the data after. These results won’t always lead to conversions right now, but they are an extremely necessary step to getting organic traffic from Google.


