Product Update. New reports for JavaScript crawling
The JetOctopus team is excited to announce one of the most anticipated updates to our tool – new data tables for analyzing JavaScript websites. This year, we have focused on improving our JavaScript crawling capabilities, and as a result of our new update, we have started tracking many important metrics for the analysis of JavaScript websites. In this text, we will introduce the new data tables and explain how they can be used to analyze JavaScript websites.
New Data Tables for JS website analisys
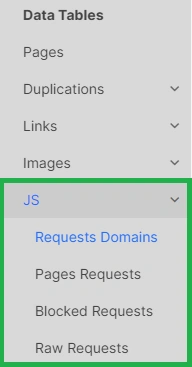
To access the new data tables, go to the “JS” data table and select the desired table. There are four new data tables for analysis for users who ran a JavaScript crawler:
- Request Domains;
- Pages Requests;
- Blocked Requests;
- Raw Requests.

Request Domains
The “Request Domains” data table contains a list of all the domains that host the resources needed to load your page. These can be external domains, such as various analytics systems, or internal technical domains where you place JavaScript files. The table provides information such as load time, average request size, maximum request size, and much more. Analyzing this data can help identify which domains are affecting the performance of your website.
Pages Requests
The “Pages Requests” data table shows a list of the resources required to load a particular page with the exact link. Here, you can find information about CSS files, JavaScript resources, font files, analytics, widgets, and more. Analyzing this table can help identify which resources are the slowest, have the largest size, and as a result, have a negative impact on Core Web Vitals metrics. This data table can be valuable for optimizing your website’s performance.
Blocked Requests
The “Blocked Requests” data table provides a complete list of requests that returned non 200 status code or had a timeout. This is an important indicator for analysis because if requests are not loaded, Googlebot and users may see only part of the content on the page, or some functionality may not work. Analyzing this data can help identify and fix issues that prevent your website from loading correctly.
Raw Requests
The “Raw Requests” data table provides complete information about all requests, including the pages where they were found, resource type, domain, status code, load time, and more. This table is useful for analyzing all requests in a special way and generating the kind of report you need for your SEO insights.
In conclusion, the new data tables for analyzing JavaScript websites provide valuable information for optimizing website performance and identifying issues that prevent websites from loading correctly. By using these data tables, you can improve your website’s performance, enhance user experience, and boost your website’s rankings.
By the way, we have many interesting articles about JavaScript SEO:
How to check JS website with JetOctopus
How to configure crawl for JavaScript websites
How to see how Googlebot renders JavaScript website
Why do JavaScript and HTML versions differ in crawl results?

