
Ways to do quick check of the website’s health
For SEO specialists, it is important to monitor the health of the website regularly. However, doing a full technical audit daily or weekly is very resource-intensive. You can spend all your time on technical checks only. That’s why we decided to offer you a way to do a website health check very quickly.
Why do you need a regular website health check?
First of all, with the help of regular checks, you can detect the problem in time and not wait until the traffic of the website drops due to a technical issue.
Secondly, it is necessary to monitor the convenience of the website for users. For example, a drop in page speed for mobile devices can increase bounce rate or have other negative effects on users behavior.
Third, with routine checks, you can get takeaways about your website and how technical health affects rankings and traffic.
Step 1. Analysis of the activity of search robots.
If something is wrong with the health of your website, you will notice it in the logs. Search engines react very quickly to various technical issues, so check the activity of different search engines first. You can compare the number of visits and pages scanned day to day, week to week and month to month. Or you can take data for 3-4 months and check whether there are no critical drops in the frequency of scanning during this period.
To do such a quick check, go to the “Logs” section – “Overview” dashboard.
In the “All bots visits” chart, you will find data about the crawling of your website by different bots according to the period you selected. If there is an atypical chart: a sharp drop or a sharp increase, this may signal technical issues.

Step 2. Check what problems crawlers and users had when visiting your website.
Next, go to the “Logs” section – the “Health” dashboard. Choose the desired period and the desired search robot. If you receive the main traffic from Google, then select “Googlebot Search” in the “Bots” field. In this way we combined data on the activity of all Google search robots, in particular Googlebot Desktop and Googlebot Smartphone.

In the charts “Problems list (Bot’s behavior)” and “Problems list (Visitors’s behavior)” you will find data on all technical issues for the selected robot and for users.

We recommend paying attention to the number of pages that have a certain problem and prioritize it. And data on user behavior will be a great argument for the client and will show why you need to fix technical issues. Because technical issues affect not only search engines, but also users who make purchases or other conversion actions.
On the “Dynamics of problems (bots)” chart, you will find data grouped by weeks or days. Here you will see how many pages had a problem (relative to all pages visited by crawlers) and how this dynamic changed during the time you selected.
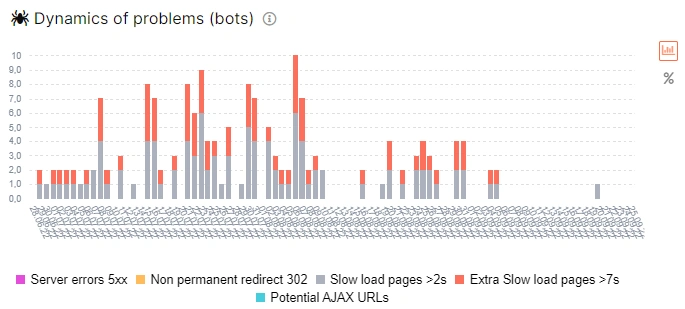
All chart columns and sections are clickable. Click on the appropriate section to go to the data table and get a complete list of the problem pages. You can do the same with the data on the “Dynamics of problems (organic visits)” diagram. Only the data table will list the 5xx, 404, slow and other pages visited by real users will be shown in the data table.
Step 3. Check your organic traffic.
Go to the section “Google Analytics” – “Organic vs All”. Next, set the desired period and country. We recommend making additional analysis for the target country.
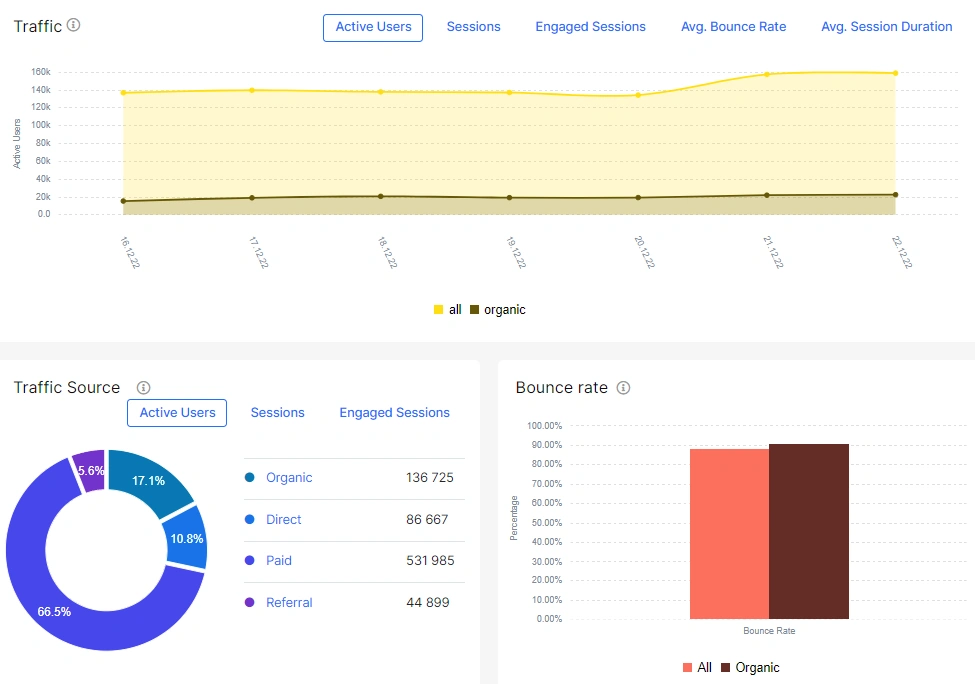
On the “Traffic” chart, you will see the dynamics of organic traffic comparative to all website traffic. If the dynamics of curves coincide, this indicates that the general trend in user behavior is normal. For example, all traffic may increase during a Black Friday’s sale and may decrease during a blackout or during the Christmas holiday.
If organic traffic varies greatly, this can also indicate problems.
Step 4. Check the effectiveness of the website in SERP.
To check the website’s performance in Google search results, go to the Google Search Console – Overview section. The “Rankings (Visibility)” diagram is best suited for a quick check. In this chart you will see the dynamics of the visibility of your website during the period you have chosen.
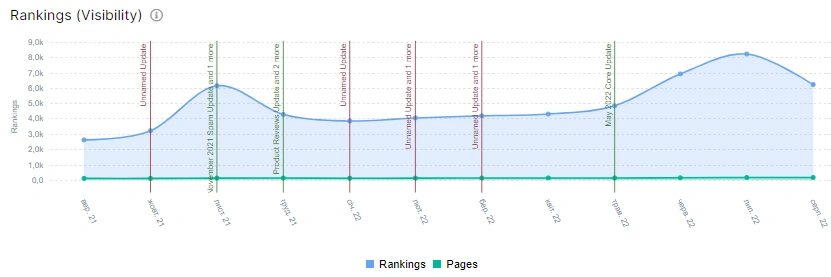
JetOctopus calculates website visibility as the number of pages and the number of keywords your website has been ranked for during the selected period.
More information: What is ranking in GSС reports and how to analyze this metric.
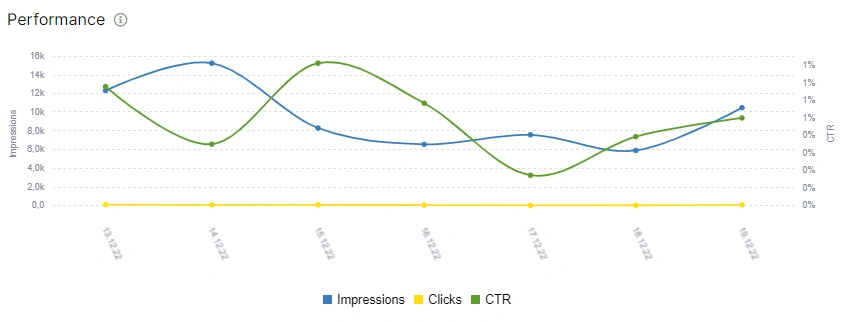
Below you will find the “Performance” chart, which shows the dynamics of clicks, impressions and CTR.
Also, during a quick check, you should check “Performance by Device”: on this chart, we display data about the performance of your website in search for different devices. You can choose which metric to monitor: clicks, impressions, CTR or position.
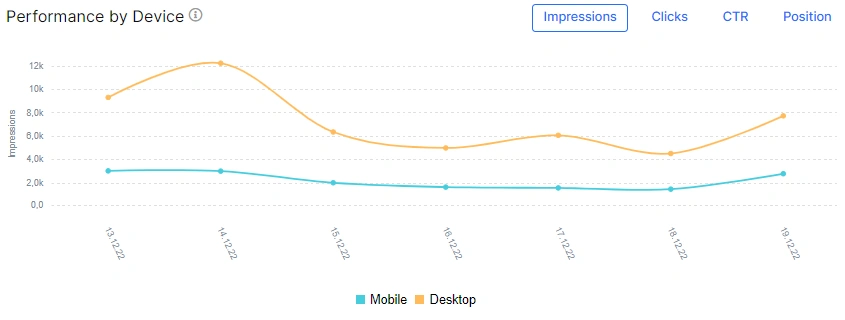
Any sharp changes in the chart can indicate problems.
Using such a quick check, you can notice a negative trend in time, find the cause and fix it.

