A guide to analyzing “Health” dashboard in logs for actionable insights
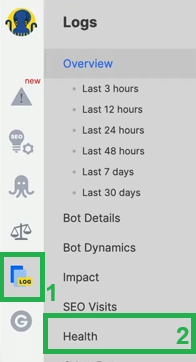
In the world of website optimization, understanding and improving user experience while catering to search engine requirements are paramount. One of the most intriguing dashboards in JetOctopus that aids in achieving this equilibrium is the “Health” dashboard, housed within the “Logs” section. In this article, we will delve into the capabilities of the “Health” dashboard, discuss the information it offers, and explore how to leverage it effectively to bolster your website’s performance.
Analyzing the “Health” dashboard
The “Health” dashboard is a treasure trove of insights, providing a comprehensive list of issues encountered by both search engines and users during their interactions with your website. This unique vantage point allows you to scrutinize the user experience and identify areas ripe for optimization and to maximize your crawl budget’s efficiency.
If you have integrated search engine logs, this report will be available in the “Logs” section.
Upon accessing the “Health” dashboard, two distinct sections come into view. The first section showcases the challenges that search engines encountered while navigating your website. The second section mirrors this data, spotlighting the problems users faced during their visits. These issues encompass an array of stumbling blocks, ranging from server errors and redirects to sluggish page loading, oversized pages, and 404 errors.

Upon entering the dashboard, select the desired timeframe for analysis, along with the specific bot and domain you wish to examine.

If you don’t see any issues in the User Behavior section, this could be due to two things. First, you integrated the logs of only a single search engine, and we cannot analyze the problems for users. The second is that your users really did not face the problem.
Evaluate each problem meticulously. If you encounter items within the problem lists, analyze them to discern the number of affected pages and the specific pages facing these issues. It’s crucial to address problems encountered by both users and search engine bots.
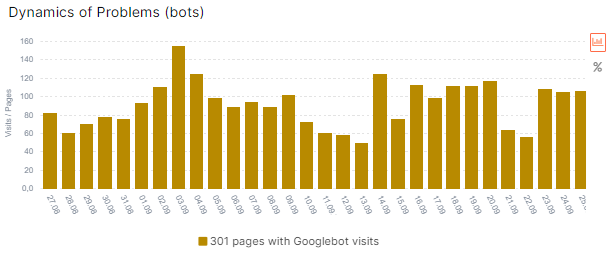
Next, go on to the “Dynamics of problems (bots)” chart below. The dashboard highlights the dynamics of issues faced by bots during their interactions with your website. If your site experienced numerous 404 or 5xx occurrences, these trends manifest graphically, allowing you to correlate them with specific website events or releases.

For instance, a surge in 5xx status codes might signify a day of exceptionally high visitor traffic, straining your web server’s capabilities to manage the influx. Simply put, your web server has been overloaded and needs to increase its capacity so that search bots always receive 200 status codes.
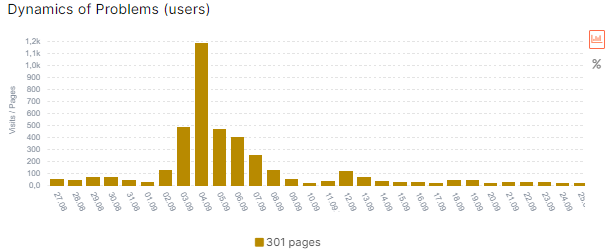
A similar chart is dedicated to user experiences, shedding light on potential challenges faced by those visiting your site.

Detailed examination matters
Each data point warrants meticulous attention. For instance, instances of slow server responses (load times) during visits can prove frustrating for users, eroding their experience. Such experiences don’t just impact conversion rates and visitor retention; they also underscore the vital link between website health and user satisfaction.
The “Health” dashboard is a comprehensive tool, enabling analysis of your website’s user-friendliness for both bots and users. Modern search engine optimization extends beyond mere keyword additions and bot-friendly configurations; it places significant emphasis on catering to users. Dissatisfied users inadvertently communicate their dissatisfaction to search engines, which can adversely affect your website’s rankings. Search engines prioritize quick-loading, informative websites to ensure optimal user experiences.
It’s crucial not to disregard issues that users encounter. Delve into potential disparities.
- If a substantial number of slow or 5xx pages are observed in bot interactions, yet none surface for users, it could indicate specific server-side bot restrictions. Addressing these is vital to safeguard your crawl budget.
- Similarly, if you notice an abundance of 401 or 403 pages for bots but not for users, it’s likely that your website’s pages are inadvertently being blocked from search engine access.
Always conduct a thorough comparison of bot and user issues to pinpoint the most critical concerns.
Final thoughts
The “Health” dashboard in JetOctopus serves as an invaluable instrument for maintaining an optimal balance between adhering to search engine requirements and enhancing user experiences. By meticulously analyzing the data provided, you can unearth bottlenecks, enhance user satisfaction, and create a website that resonates effectively with both search engine algorithms and user expectations. Vigilantly addressing both user and bot concerns ensures your website’s seamless performance, translating into improved search engine visibility and increased user engagement.


