Why is a different number of logs displayed in GSC and in your logs?
You may have noticed that the number of crawled URLs in the Google Search Console “Crawl stats” report may differ from the number of URLs visited by search engines that you see from the JetOctopus logs. Why this is so and how to correctly count the number of visited pages, read in this article.
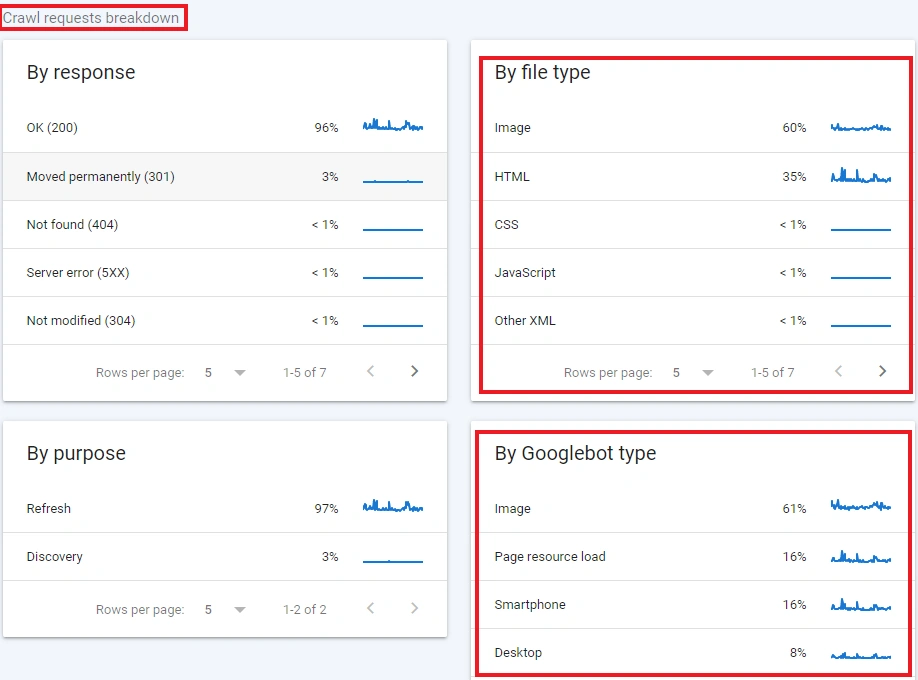
1. The most important thing to remember is that “Crawl stats” includes absolutely all types of processed resources by all types of Googlebots. These are processed Java Scripts (including on the client side), and images, and actually, the pages themselves. In the default logs of the web server, only search robots requests to a specific URL address are displayed. Let’s look at a concrete example. You have a page that contains three images and two JavaScript files that are executed by the client browser. The search engine sends a GET request to this page, and you get a log line. This log line will also be shown in JetOctopus. However, in addition to the GET request to the page, the search bot will process three images (without a separate GET request to each image URL) and execute two JavaScript files. Google Search Console will take into account all these actions of search engines. But in your logs you will find only one Googlebot’s visit.
You can also configure additional logging to see all these processes.

On the screenshot you can see the statistics of visits of all robots and execution of all types of files. This is all taken into account in the “Crawl stats”.
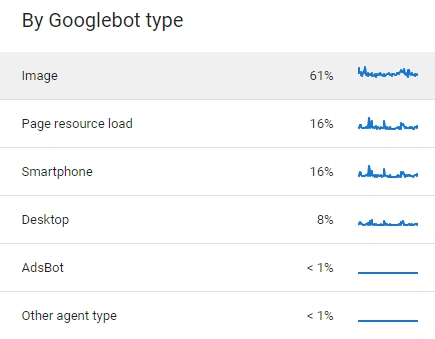
2. The “Crawl stats” take into account all types of Google robots. These are search bots – Google Smartphone and Google Desktop, advertising AdsBot, etc.

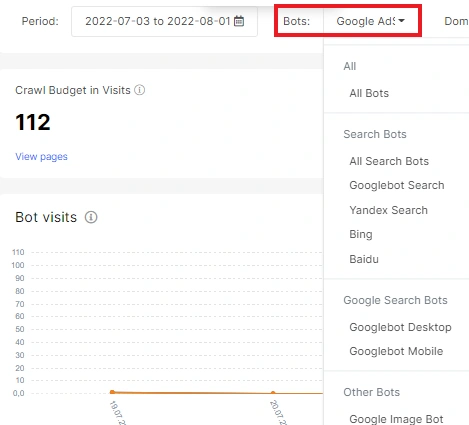
Instead, JetOctopus focuses primarily on search bots in its logs. To view the visits of all Google robots, add the appropriate filters:
- select the desired robot at the top (you can add this filter in all dashboards and data tables);

- filter the logs of the required bots in the data tables using the filter User Agent String and Bot Validation Status – Valid.

3. In most cases, JetOctopus shows logs in real time. “Crawl stats” in Google Search Console show data with a two to three days delay. That is, in JetOctopus you can see the visits of Google robots already in the last hour. On the other hand, in Google Search Console, the latest records are displayed with a delay of two or three days. As a result, the data may vary significantly.
4. If you do not see all the log lines in JetOctopus, it may be related to your web server settings. You can see the logs from the workhorse server and not from the cache server. If the first layer has data for you, then you will only see the cache, but not the currently rendered page.
Instead, Google Search Console will display data from servers of all layers.
Also, your website may have multiple servers. There are also situations where each subdomain has a separate server. In such cases, you need to check whether logs are integrated into JetOctopus from all web servers.
Crawl statistics and logs in JetOctopus may differ for the reasons listed above, but it is important to ensure that the number of HTML documents visited Google matches both in GSC and JetOctopus.

