Product Update. Google Analytics at JetOctopus
We are happy to present to your attention a new large update. Now you can integrate data from Google Analytics and use it to analyze page performance.
Who is Google Analytics at JetOctopus integration available to
Each client can set the integration of the website with Google Analytics. We would like to emphasize that the integration works only with Google Analytics 4. All data will be automatically uploaded daily, so in case of deviations, you will be able to quickly correct the situation.
Why should you use Google Analytics integration?
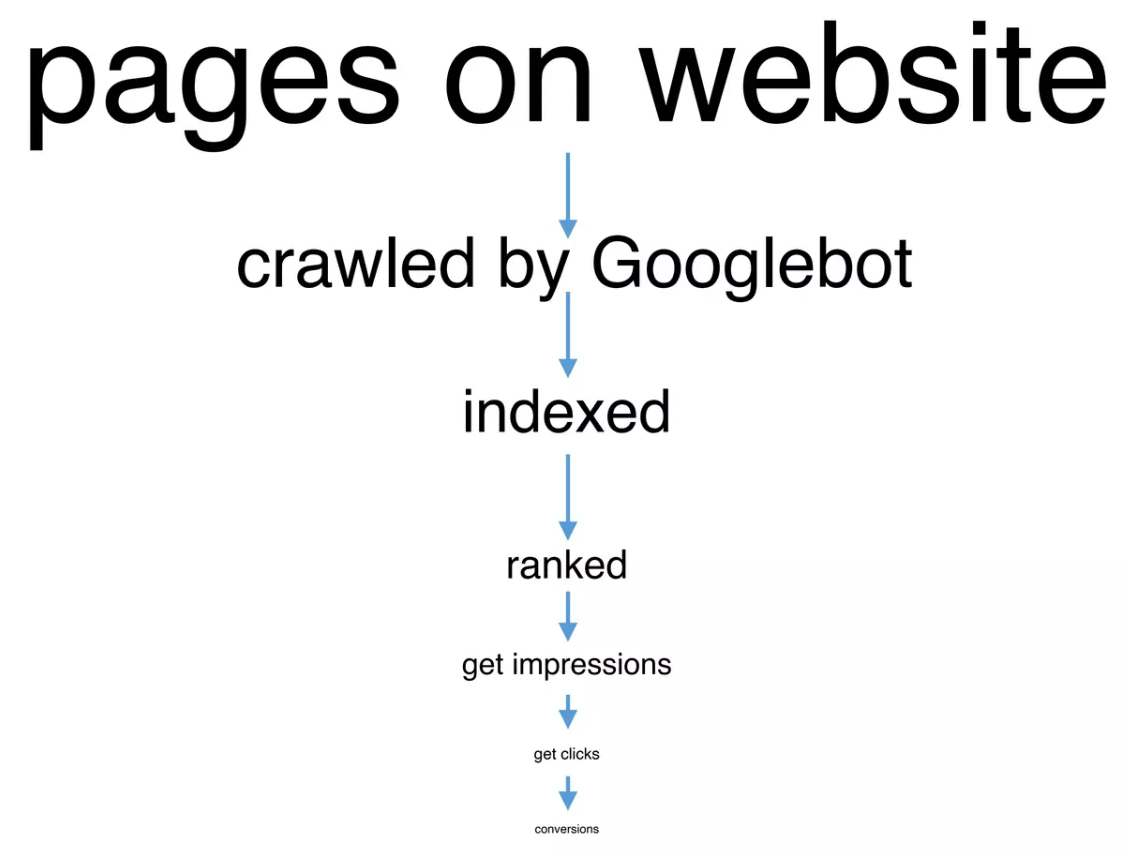
“I already use Google Analytics, this data is enough for me,” you say. But now you’ll be able to get cleaner data about your SEO performance. For example, collect all the pages found by the crawler, then sort those that have been scanned by search engines. The next step is to filter out those that had impressions and clicks in SERP. And now you can add information about user behavior from organic. Did all the users who clicked continue interaction on your website? How many of these visitors were new users? How long did they spend on the site?
That is, now you will have a complete picture of the SEO funnel.
More ideas about SEO funnel: Take Control on Googlebot: the best takeaways from Serge Bezborodov’s talk at BrightonSEO.
With our visualizations and the ability to compare data from crawls, logs and Google Search Console, you can seriously evaluate the effectiveness of SEO and gain powerful insights.
What charts and data visualizations you can use
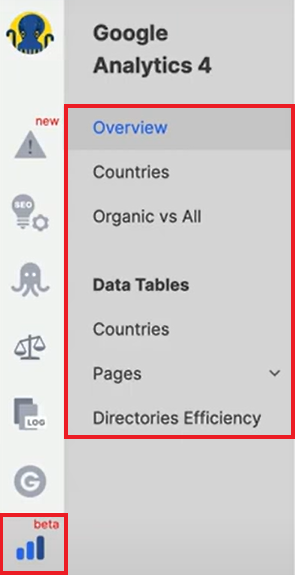
Go to the “Google Analytics 4” section. Then select the desired report: “Overview” with general data, “Countries”, “Organic vs. All”. Also, you can view raw data in data tables.
To get started, set the desired period, country and traffic source. And you can choose a built-in or manually created segment of URLs.

In the “Overview” report you will find information about all active users and their sessions. Pay attention to the percentage next to these indicators: this is a comparison to the previous similar period.

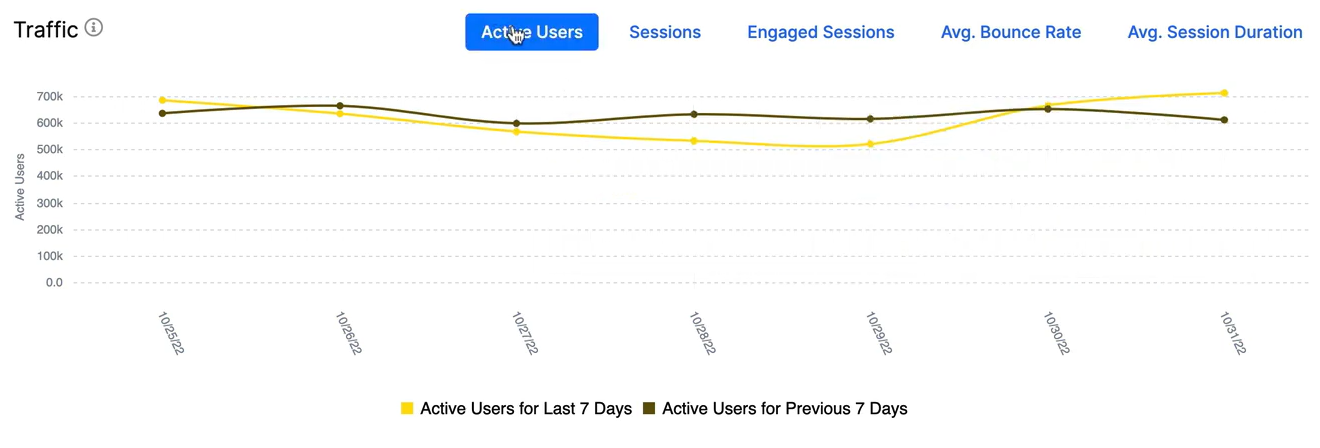
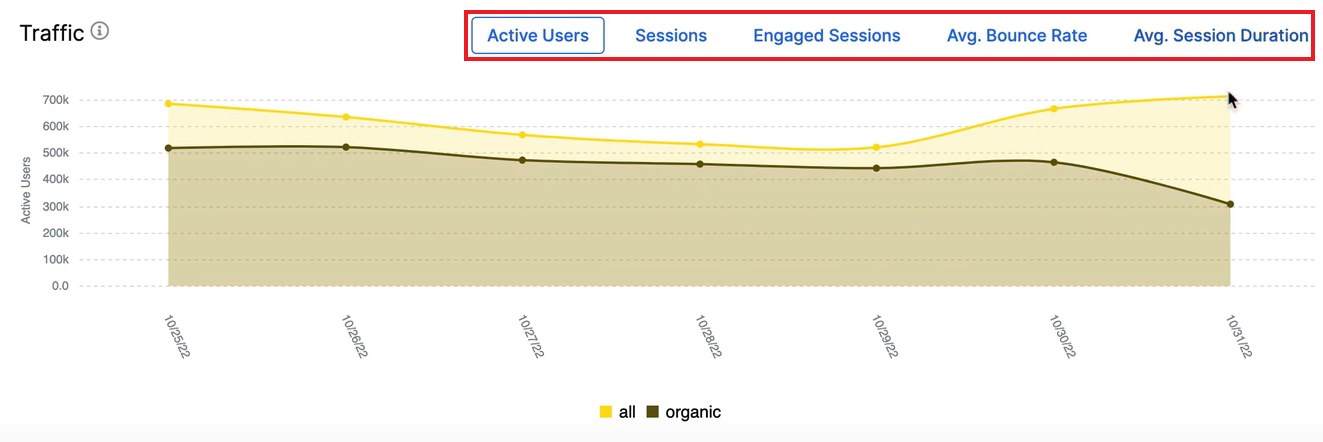
On the “Traffic” dashboard, you can see the dynamics of traffic and sessions during the period you selected.
Let’s go to the “Countries” dashboard. Here you will find data on the top countries in terms of traffic, sessions and users, as well as information on the total number of countries you were coveraged in.

The chart with the dynamics of various indicators by country is very interesting. Select the desired indicator for analysis.

On the “Organic vs. All” dashboard, you can compare organic traffic with other types of traffic by users, sessions and bounce rate and so on.


Data tables are no less interesting. In the “Countries” data table, you will find a list of all countries and their capacity for the selected period. It’s very handy to analyze all the information, isn’t it?

However, one of our favorite data tables is Pages. Here you will find new pages: which had no sessions and users during the previous period, but had during the selected period.
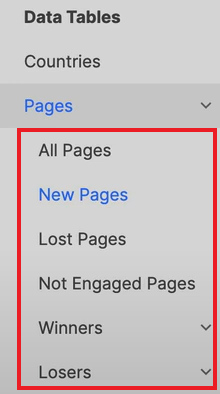
The same information, but about lost pages, is in the following data table. Go to “Lost Pages” to see those URLs that had traffic in the past period, but did not receive any sessions in the period you selected. This is a great way to find pages that are no longer driving traffic and fix those pages so they start generating traffic again.
And finally, we’ll show you the “Directory Performance” data table. Maybe, you have previously manually generated reports to understand the performance of different types of pages. For example, blog pages, categories or products. Now you can track this data with JetOctopus.
We highlighted the bounce rate as the most important criteria for the effectiveness of all directories of your website. Pages with the lowest bounce rate are highlighted in green, pages with the highest bounce rate are highlighted in red.

JetOctopus doesn’t just show data from Google Analytics, it highlights the most important ones so you can interpret and use it to improve your SEO strategy. With Google Analytics, you can use URL segments, join datasets from logs, Ahrefs backlinks and crawl. This is an extremely powerful tool, so we recommend that you start using it now.
In 2022, JetOctopus made many cool updates. Here are some you might be interested in:
Product Update. GSC Discover: dive deep into search results analysis
Product update. Alerts for advanced website monitoring
Product Update. GSC by Countries.
Enjoy using it!

