
Product Update. GSC metrics dynamics
We are pleased to present to your attention an interesting dataset that will help you analyze your search metrics. How effective are your pages in search? How many clicks and impressions does a certain segment of pages receive for specific queries? What is the average position for each query in different countries? Now you don’t have to manually update data in hundreds of tables, JetOctopus has done it all for you!
Please note that we take all data from Google Search Console. Therefore, in the new “Metrics Dynamics” dataset, you will see the most accurate information about Google search results.
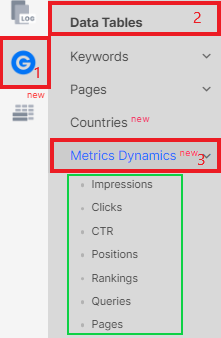
“Metrics Dynamics” is available in the Google Search Console section. Here you will find detailed information about clicks, impressions, CTR, positions and more. This dataset is available to all users who have integrated GSC.
More information: What is ranking in GSС reports and how to analyze this metric.
How to use GSC Metrics Dynamics
Go to the GSC section – data tables – general report “Metrics Dynamics”, select the period and device.

Next, select in the “Group By” field what you want to get information about: pages, queries, countries, queries in different countries, pages in different countries and so on. In the “Metric Field”, select what exactly you want to analyze – select the necessary metric by which you will measure the effectiveness of pages or queries. These can be clicks, impressions, positions, etc.
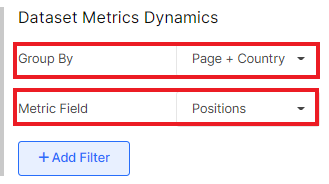
If you choose “Page” and “Impressions”, then in the results you will see a datatable with the total number of impressions for the pages that were shown in SERP during the period you selected. A greener color indicates a better result.

As you can see, the data is grouped by day. This allows you to track the dynamics. You can group data by days, weeks or months in the period settings.
What can you use Metrics Dynamics for?
1. To find the most effective keywords.
2. To analyze the effectiveness of pages and requests in different countries.
3. To find the pages that have the lowest CTR.
4. To compare search results in different countries.
5. Find out the average position of all your pages in different countries.
The possibilities are endless. With “Metrics Dynamics”, you can find tons of insights.
Use additional filters. To do this, click the “+Add filter” button, filter queries or URLs, or select the most effective pages.
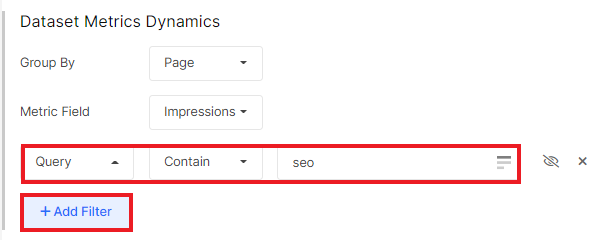
You can also use segments or create a new one.

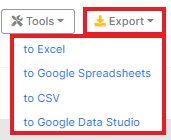
To export a “Metrics Dynamics” dataset, click the “Export” button and select the desired format.
Enjoy using it! We will be grateful for your feedback!


