
Analyzing JavaScript load time: key metrics for website performance
Load time for static websites is relatively straightforward, measured as the server’s response time to a client request. However, for JavaScript (JS) pages that involve numerous resources, defining load time becomes more complex. In this article, we will consider the key metrics of JS load time and tell you how to analyze them using JetOctopus.
Importance of analyzing load time for JS pages
Analyzing load time for JS pages carries significant importance due to various reasons.
- Enhancing user experience. Load time plays a crucial role in determining user experience. A slow-loading JS page can result in reduced user satisfaction and engagement. By optimizing load time, you can increase the percentage of successful user interactions and create a smoother browsing experience.
- Impact on Core Web Vitals and page performance metrics. Load time directly influences several Core Web Vitals metrics and page performance indicators. Metrics such as Time to First Byte and First Paint are directly affected by load time. Improving these metrics can yield better search engine ranking position (SERP) results, improving visibility and organic traffic.
JavaScript load time analysis
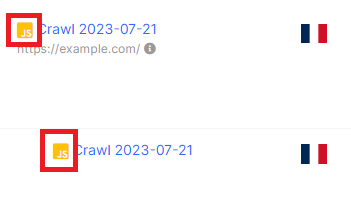
To analyze the load time for a JavaScript website, you need to start a JavaScript crawl or select the crawl you want to analyze from the list. Please note that all JS crawls are marked with a special icon. For default crawls, information about JS load time will not be available.
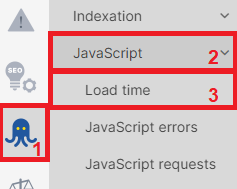
After completing the crawl, go to the “JS Performance” dashboard and select “Load Time”.
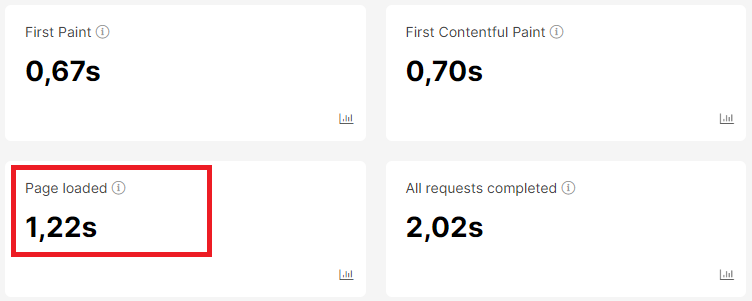
In this dashboard, you will see the average data for all pages of your website.
Pay special attention to the “Load time distribution” chart. Here you will see the distribution of pages by load time.
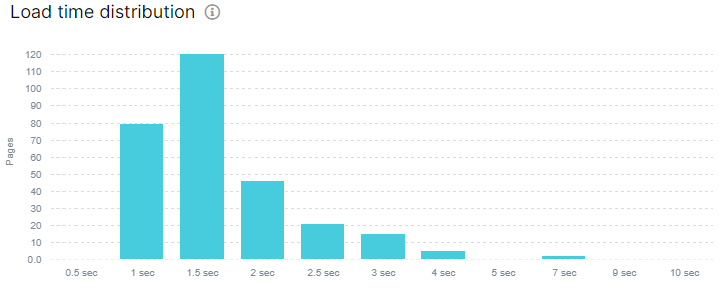
By clicking on the corresponding column, you will go to the data table with detailed results.

Analyze in detail the slowest pages and determine the reason. Perhaps the number of resources is very large or there are blocked JS resources that slow down the loading of the entire page.
You can also analyze the time of each performance event for the JS page. General information is available on the “Browser performance events” chart.
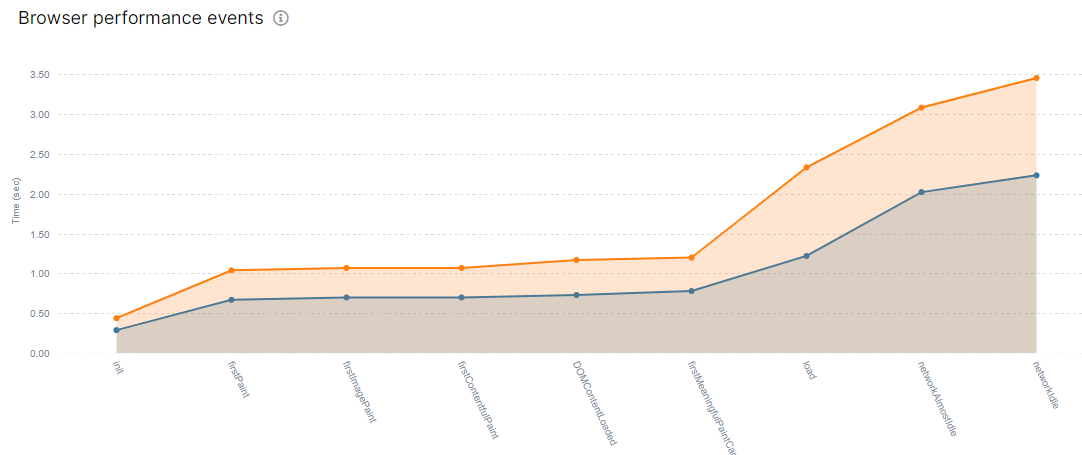
In this chart, you will find information about every important event for a page’s JS and the time it takes most pages to execute that event. All events are important for loading your JS pages.
By carefully analyzing and optimizing JavaScript load time, website owners can enhance user experience, improve Core Web Vitals metrics, and achieve better SERP rankings. Regular monitoring and optimization are essential for maintaining optimal page performance and ensuring a seamless browsing experience for users.


