
Core Web Vitals Optimization: Best Practices and Expert Thoughts
It’s no news that Google is gradually increasing its focus on rewarding websites that deliver an outstanding user experience (UX) with better rankings. How well — and how fast — the content on your site’s various pages load lies at the core of delivering a great UX.
Conventional website performance metrics like page load time and DOMContentLoaded are easy to measure but don’t necessarily translate well to what users care about. If you focus only on optimizing your average page load time and call it a day, you’ll likely end up with a website that still renders a so-so UX.
Enter Core Web Vitals.
In May 2020, Google introduced a set of user-centric performance metrics called Web Vitals. These metrics serve as a more granular, UX-centred way of measuring and optimizing page load time.
And guess what? Starting June 2021, Core Web Vitals (CWV) are included as page experience ranking signals together with existing search signals such as mobile-friendliness, safe-browsing, HTTPS security, and intrusive interstitial guidelines.
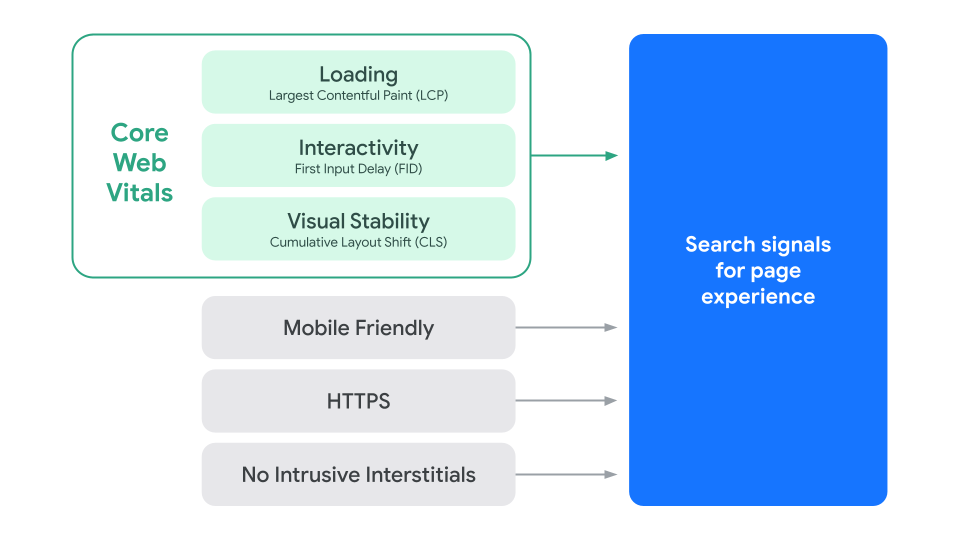
In this guide, we’ll cover all the basics of Core Web Vitals — what they are, their impact on SEO, how to optimize them, useful tools, common myths and misconceptions, and more. We also talked to 16 SEO experts to get their opinions and tips on CWV.
Let’s dive in.
What are Core Web Vitals?
To start with, here’s a brief description of the three Core Web Vitals as shared on the official Chromium blog:
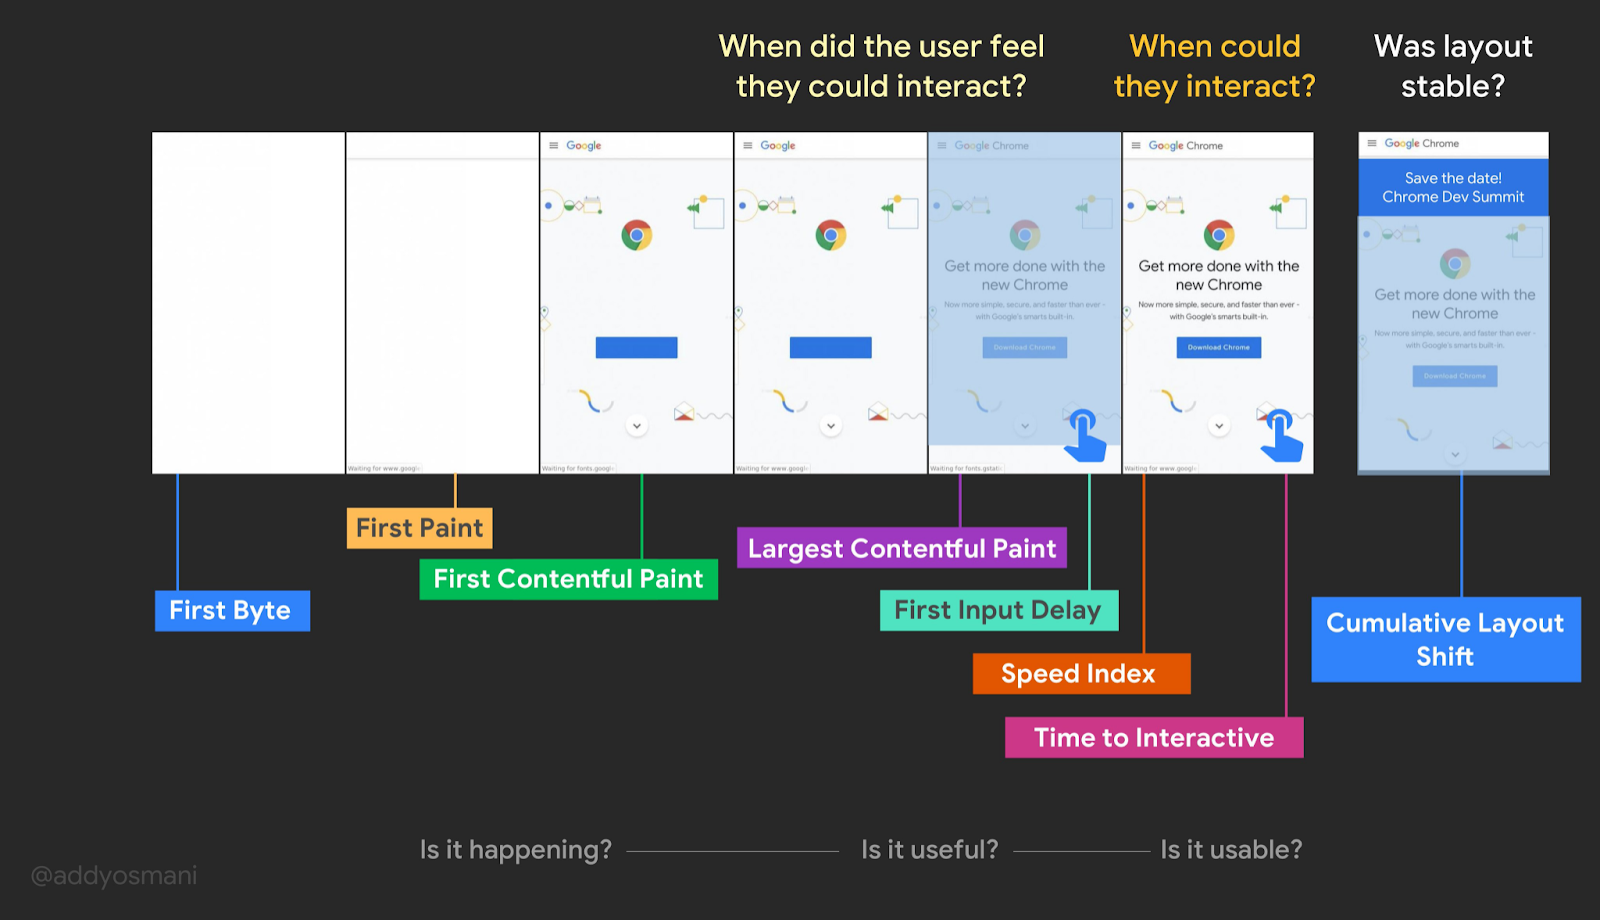
- First Input Delay (FID) measures responsiveness and quantifies the experience users feel when trying to first interact with the page.
- Cumulative Layout Shift (CLS) measures visual stability and quantifies the amount of unexpected layout shift of visible page content.
- Largest Contentful Paint (LCP) measures perceived load speed and marks the point in the page load timeline when the page’s main content has likely loaded.

So in essence, Core Web Vitals are a set of user-centric performance metrics related to speed, responsiveness, and visual stability that help you measure the level of UX your website renders.
Besides these three core metrics, other Web Vitals include:
- First Contentful Paint (FCP) measures the time from when the page starts loading to when any part of the page’s content is rendered on the screen
- Time to Interactive (TTI) measures the time from when the page starts loading to when it’s visually rendered, its initial scripts have loaded, and it’s ready to respond to user input quickly.
- Total Blocking Time (TBT) measures the total amount of time between FCP and TTI where the main thread was blocked for long enough to prevent input responsiveness.
Below is Addy Osmani’s visualization of Web Vitals that shows how a page loads and where the different metrics come into the picture.
The “Enhancements” section of your Google Search Console shows you how the pages on your site perform based on the Core Web Vitals.
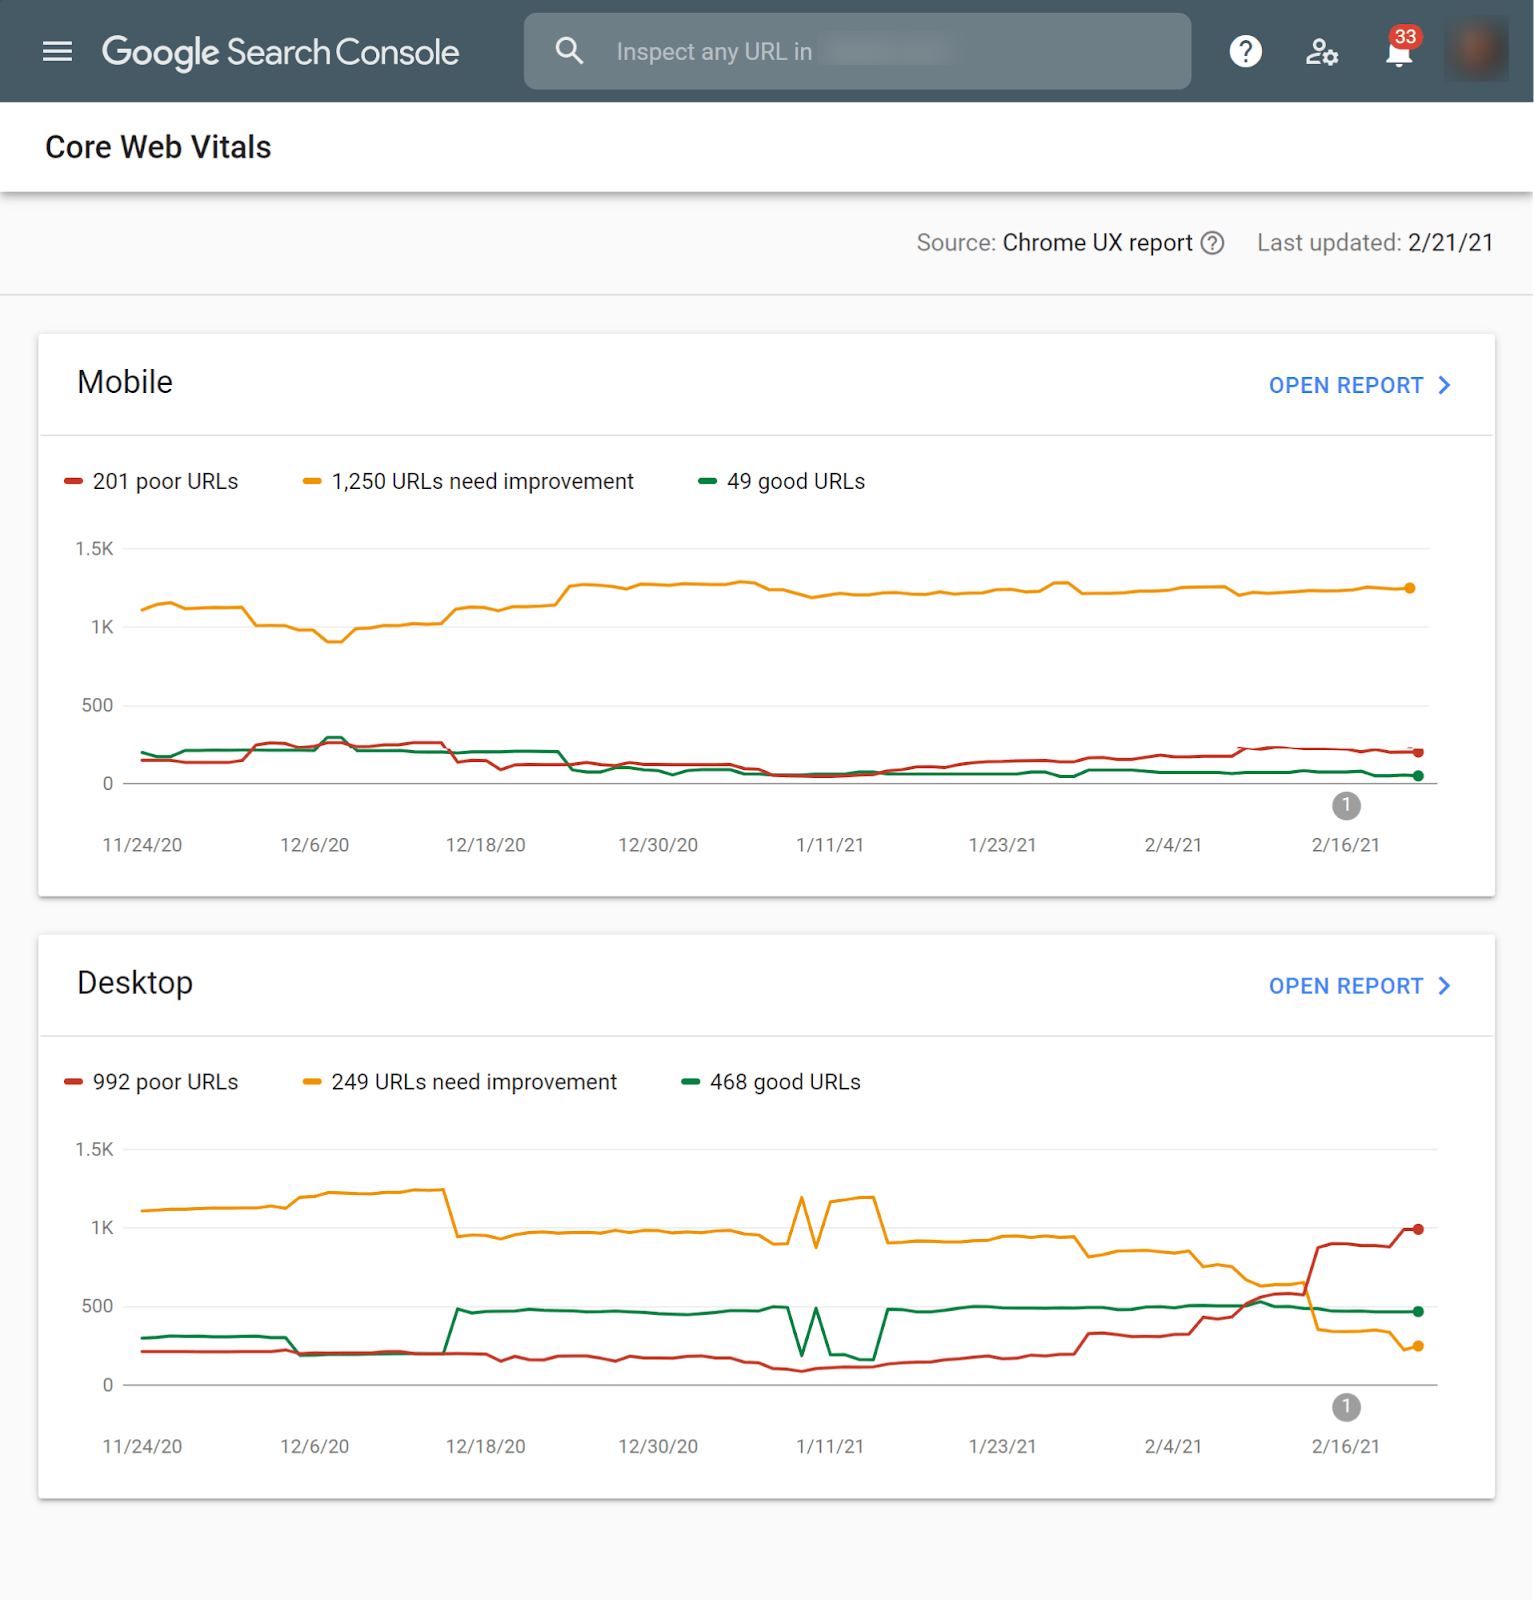
When you open the Core Web Vitals report, you get detailed information on specific issues and a list of affected pages.
Are Core Web Vitals important for SEO?
In a word, yes — but don’t go overboard with the hype. There are well over 200 ranking factors and signals, and it’s unknown how much they will impact rankings. As many of the page experience signals were already used by Google to rank websites, the influence of CWV would likely be considerable but not huge.
So while CWV makes up the biggest chunk of your page experience score, it won’t “override having great, relevant content,” as Google states.
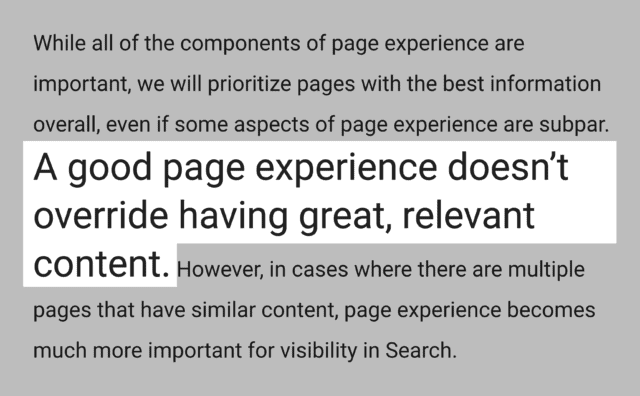
And technical SEO experts agree.
“It’ll be less important than content relevance, links, and RankBrain. I’d predict it’d mean a lot more in certain industries where content is similar (hello syndicated news content) but not so much in other spaces where content is more unique. It’s pass/no pass for now. I’m going to wait and see if there will be any visual tagging impacts CTR,” says Victor Pan, Principal Marketer, Technical SEO, at HubSpot.
Helen Pollit, SEO Manager at iTech Media agrees: “In my opinion, not as important as the industry might believe. Google has said in its developer documentation that page experience will be among the hundreds of other signals used to determine ranking.”
“It doesn’t override the need for great content, information that Google can access, understand and see as relevant to a searcher’s request. It is important, however, for the enjoyment of the user trying to access that content. I believe that is Google’s goal with this; to encourage us to create better web experiences. Whether those better web experiences will significantly change the SERP landscape when the update rolls out – I’m doubtful,” she adds.

How to make your eCommerce Store CWV friendly?
Before we dive deeper into each of the CWV metrics, let’s consider eCommerce websites in particular. When asked How eCommerce companies can improve their CWV score?:
“Ecommerce companies are in trouble because the major platforms severely limit what you can and cannot do. Then there are the plugins that you use for reviews, ratings, remarketing, pop-ups, SMS, etc… that you also have no control over,” says Adam Riemer, President, Adam Riemer Marketing, LLC.
“It can be more challenging since eCommerce sites are dynamic making it difficult to benefit from page caching, but if the site is built well, it can achieve a decent score,” says Mark Davoli, Senior Web Developer at Amsive Digital.

In other words, eCommerce businesses would find it more difficult to make their website CWV-friendly owing to how they’re typically packed with heavy visual content and numerous product pages.
And to answer the above question:
“Hosting is key. Depending on your eCommerce platform, you may require proper server architecture and if you do not have this you will have poor server response time which will kill all Core Web Vitals metrics. Server speed is an absolute must and should be your number one priority,” explains Davoli.
“Build your site using modern HTML, CSS, and JavaScript, and minimize the need for unnecessary code on each page. Optimize your site for your LCP (Largest Contentful Paint) preloading the image and fonts necessary to display it as fast as possible while delaying/deferring the rest. Drop IE11 support if you still have it as supporting IE11 adds to excessive code bloat,” he adds.
He also suggests to “eliminate most render-blocking JavaScript by deferring or delaying its execution. If JavaScript is required to render above-the-fold content, then it should be inlined directly into the HTML for speed. This will help with all three metrics LCP (Largest Contentful Paint), FID (First Input Delay), and CLS (Cumulative Layout Shift). CLS (Cumulative Layout Shift) is one of the easier metrics to get a passing score for so focus and eliminating CLS for a decent benefit.”

Colt Sliva, SEO Engineer at iPullRank, also shares his approach:
“I start with FID is how long it takes for the server to respond. It can be positively changed by speeding up things like compression or server requests. I usually suggest implementing Brotli compression. It’s slightly faster than gzip, and in case studies has optimized asset delivery by about 8%. This is great for eCommerce companies who are usually trying to render as many product images as possible on listing or category-type pages.
Next, we tackle LCP which is technically when the largest element renders, but really is more a measure of when most of the assets have been received and rendered on the client-side. There are a million strategies to optimize for LCP, but my favorites are Adaptive Serving and Service Worker Caches. These strategies are fantastic because they can be implemented on any type of ecommerce platform. Even with the more limited ecommerce CMS’s, as long as you can control your javascript, you can implement these.
Finally, CLS is less likely for eCommerce, but if you’ve got any shifting or moving of content, fix it! Often, you can put a placeholder in while the content loads, and then once it’s ready, remove the placeholder and embed the new content,” explains Sliva.
“Every single eCommerce website is different. The only one way to improve Core Web Vitals, and more importantly organic rankings, is to conduct an in-depth technical SEO audit,” answers Fili Wiese, SEO Expert, SearchBrothers.
“In the end, we as website operators are responsible for the signals going into the Google algorithms (crawling & indexing) and that helps determine what comes out (rankings). To improve the latter we need to focus on the former,” adds Wiese.
With so much talk about FID, LCP, and CLS, let’s better understand each of these metrics.
The three components of Core Web Vitals
While Core Web Vitals are an evolving set of metrics, presently, the set is composed of three metrics discussed below.
Largest Contentful Paint (LCP)
LCP measures the time from when a page begins loading to when its largest text block or image element is displayed on the screen.
So it essentially indicates the time taken for a page’s main contents to finish loading. The lower the LCP, the better. It’s equivalent to perceived load speed from the user’s perspective.
It’s important to note that when a page is loading, the largest text block or image element may change, and the most recent element is used to determine the LCP. For instance, an H1 tag is the largest text block at the start, but later on, if a larger image element is loaded within the viewport, it is then the element used in measuring the LCP.
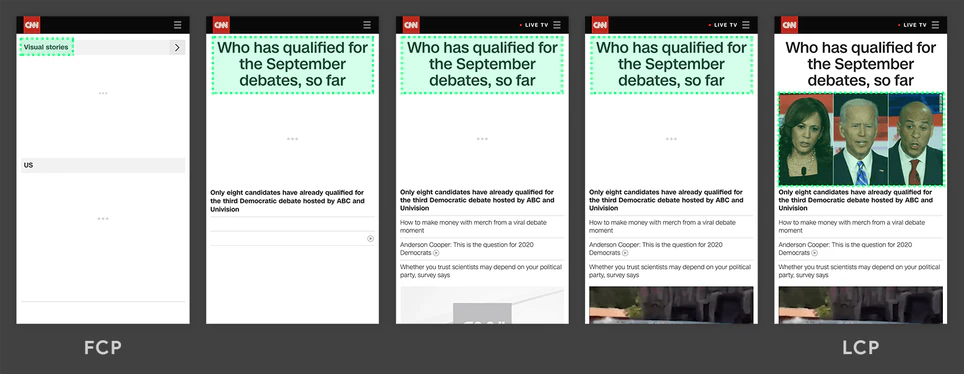
LCP is measured in seconds and here’s how to interpret your LCP score:

So you aim to have an LCP below 2.5 seconds. You can check your LCP in Google PageSpeed Insights to see how your page performs in the real world (using “field data” based on users’ Chrome browser data).
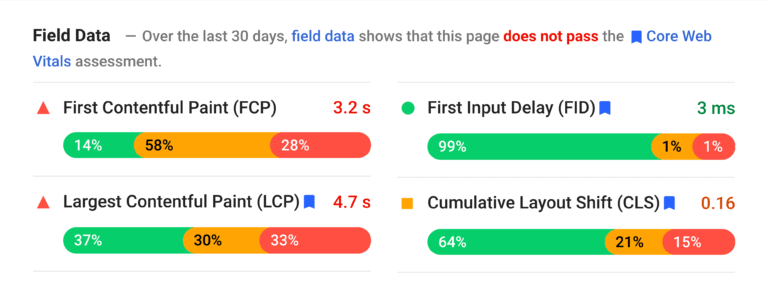
And as mentioned earlier, it’s also worth checking your LCP data in your Google Search Console (GSC), as this way you can see the LCP data of your entire website. You get a list of URLs that are good, poor, or need improvement.
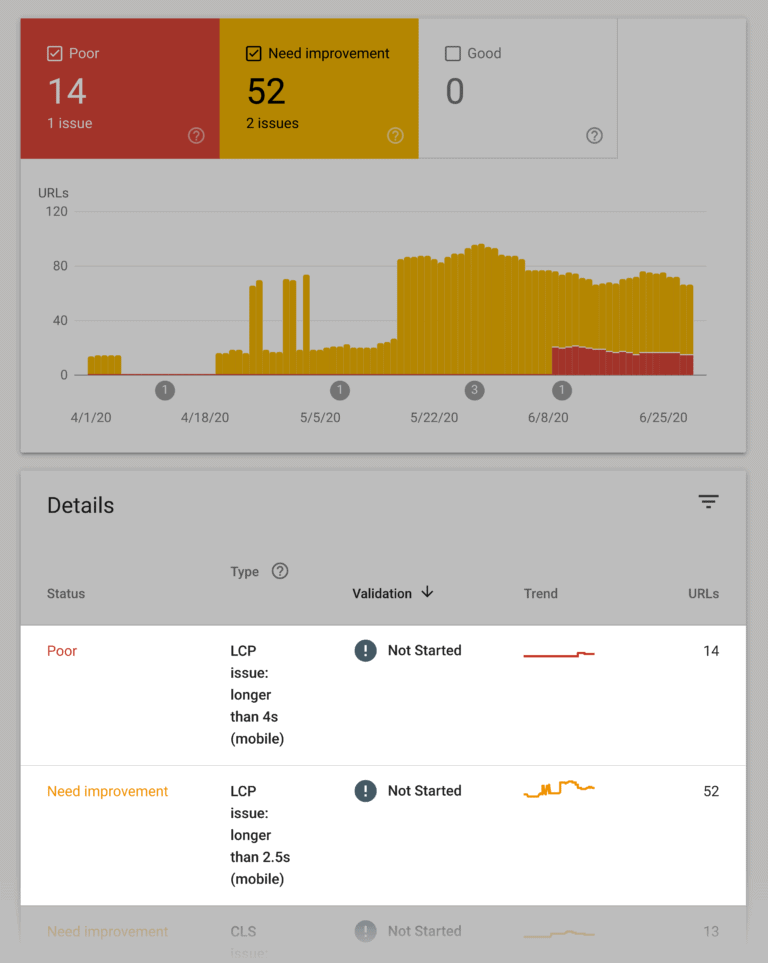
There’s plenty you can do to improve your LCP, such as:
- Remove any unnecessary third-party scripts
- Upgrade your web host
- Use lazy loading
- Minimize large page elements
- Minify CSS
First Input Delay (FID)
FID measures the time it takes for a user to get the ability to interact with your page, such as clicking an option from the navigation bar or checking a checkbox. It does not include scroll or zoom.
It forms a user’s first impression of your site’s interactivity and responsiveness. As FID considers how real-life users interact with websites, Google views it as an important user-centric performance metric, especially for pages where users wish to quickly click or input something. The lower the FID, the better.
However, as not all users interact with a page upon loading, you may not see an FID value for all pages (such as blog posts). This is also why you can’t find lab data on FID. For testing within the lab, Total Blocking Time (TBT) is used, as it’s quite similar to FID.
FID is measured in milliseconds and here’s how to interpret your FID score:

As with LCP, you can check your FID in Google PageSpeed Insights as well as GSC. And here are a few key ways to optimize your FID scores:
- Defer unused JavaScript
- Reduce JavaScript execution time
- Remove any unnecessary third-party scripts
- Enable browser caching
Cumulative Layout Shift (CLS)
CLS measures how the various elements on your page move around in the viewport as the page finishes loading. Simply put, it measures the visual stability of your page and if elements on your page shift their positions significantly as the page loads, then you’ll have a high CLS (which is bad for user experience).
So the lower the CLS score, the better. Essentially, aim to have your page elements remain stable as the page loads, so users don’t have to re-learn where links, content, and fields are located when the page is fully loaded, and won’t click on something by mistake.
Unlike the other two CWV, CLS isn’t measured in seconds. Instead, it considers the viewport size and the elements that move between two frames — known as unstable elements — and evaluates their movement in the viewport.
The score is a product of two components:
- Impact fraction: The area of the viewport that the unstable element takes up in both frames.
- Distance fraction: The maximum distance the unstable element moves between both frames, divided by the viewport’s largest dimension (width or height).
Here’s how to interpret your CLS score:

Here are a few common reasons for high CLS:
- Having images, ads, embeds, and iframes with undefined dimensions
- Injecting content with JavaScript
- Implementing fonts or styles late in the load
In Google PageSpeed Insights, under Diagnostics, you can see a list of the elements that are shifting.
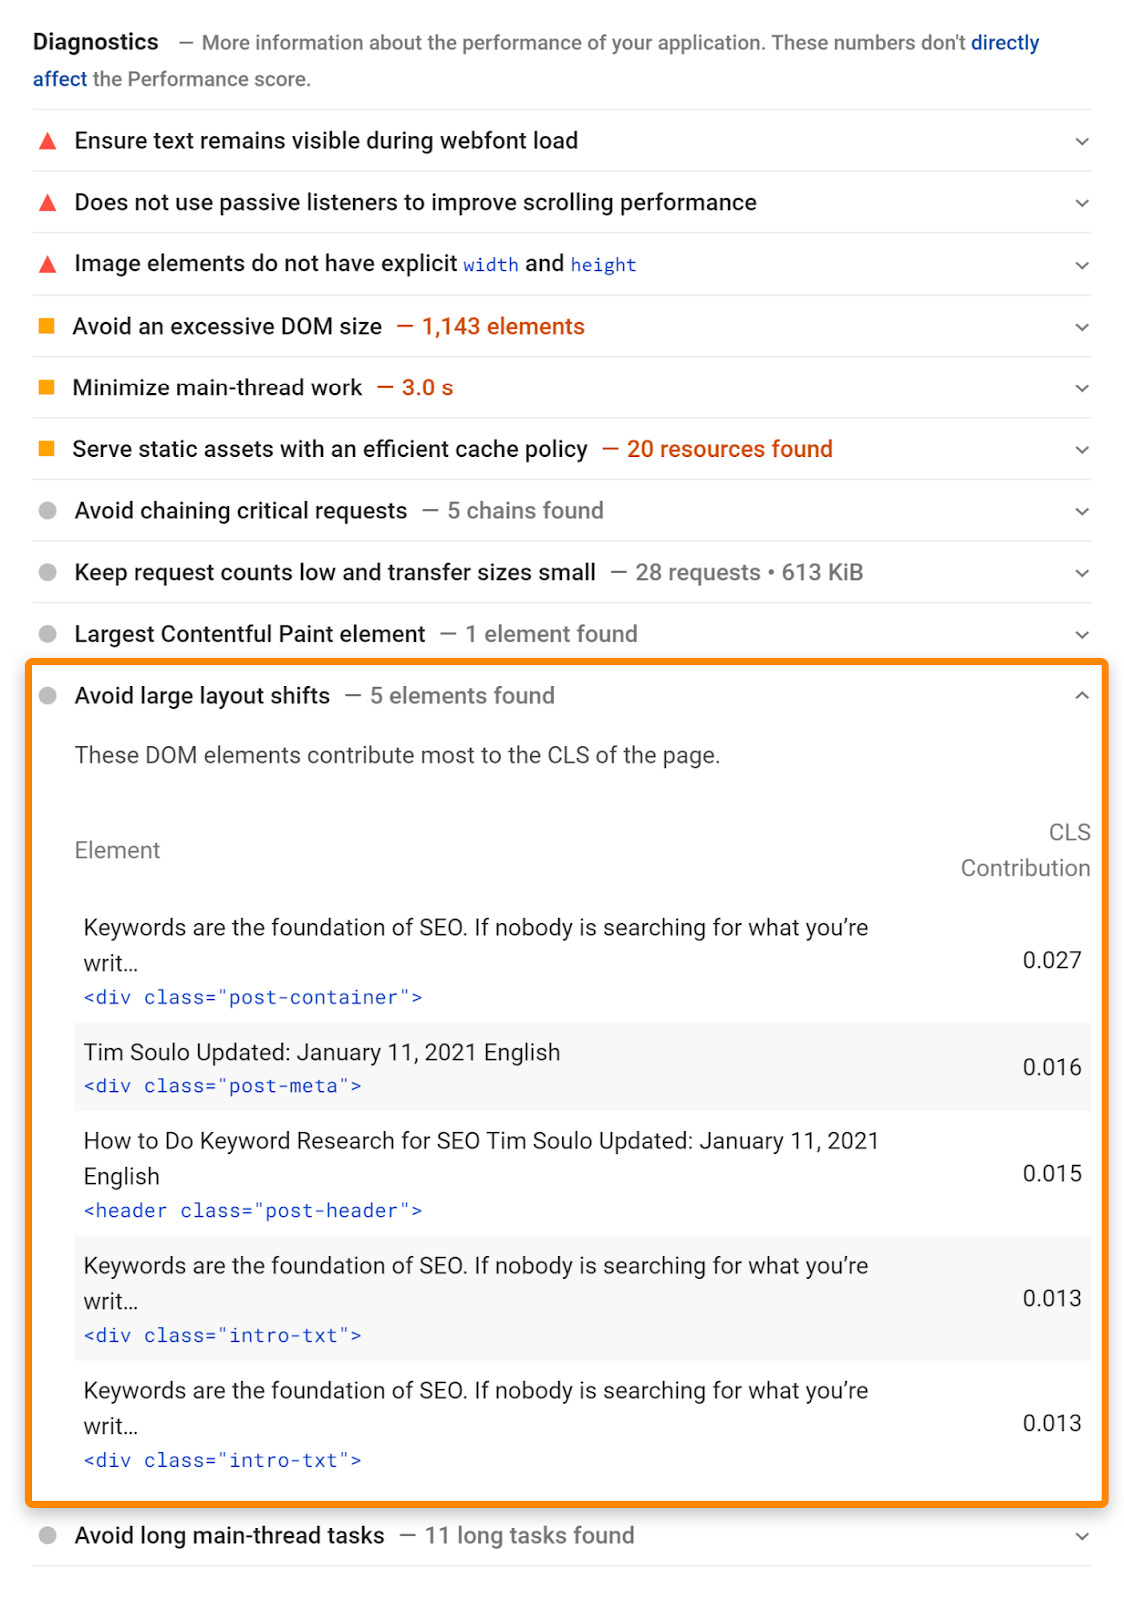
Here’s what you can do to optimize your CLS score:
- Include size attributes for your images and videos
- Ensure ad elements have a reserved space
- Add new elements or content below the fold
Check out this article on Search Console Help to understand and navigate your Core Web Vitals report which shows how your pages perform based on real-world usage data, known as “field data”.
How to optimize Core Web Vitals
You already have an idea of the things you can work on to improve each of the Core Web Vital metrics. In this section, let’s take a look at how to optimize your overall page load speed, including CWV.
Here’s an actionable performance optimization checklist to tick off for your website.
Server optimization
If your server is sluggish, all your efforts to optimize your code, images, and other elements would be in vain. So first things first, optimize your server. Here are a few ways to consider.
Upgrade to a Faster Server
Consider upgrading to a dedicated server or managed cloud hosting, if your budget permits.
Use a CDN
If possible, use a content delivery network (CDN) for your images, videos, and all other multimedia files. You may also consider offloading stand-alone script files.
Preload DNS Queries
Prefetching DNS queries helps reduce the delay between an asset being requested by a user and the display of that asset.
So when you use a CDN to store content assets, by loading the CDN’s domain before it’s called for the first time, you further improve page load times.
Preload Your Cache
A cache plugin or script essentially caches a new page visited by the first visitor for future visitors until the cache expires. So, the first visitor has a slower experience compared to future visitors.
By preloading your cache, you can ensure that when visitors or Google crawlers visit your page for the first time, they don’t experience a slow load speed.
Consider a Server-Side Cache
An HTTP accelerator software such as Varnish Cache acts as a server-side cache to further speed up the generation and serving of the cached version of your page.
Varnish Cache is an open-source project maintained by an active community and is an efficient solution to boost not only your site speed but also your server performance.
Image optimization
Images are one of the biggest influencing factors on your CWV and overall performance. Most web vitals measure the time until some initial rendering, and images are usually the largest source of delay before a page is fully loaded.
And so, image optimization is another key area to focus on. Below are a few tactics to consider.
Reduce the Dimensions of Background Images
Background images are usually not a necessity to great design and can be a major source of delay in loading a page for the first time. So if you use background images, minimize its size so it loads near-instantly.
Minimize or Replace Background Images with Patterns
To take the above point further, if it’s possible, replace the background image with flat colors, a gradient, or a simple pattern. This way, you can minimize the number of assets that need to load before the initial load of the page is complete.
Remove Images on Mobile Above the Fold
Mobile browsing is more prone to delays in the first input and content shift, as the quality of signal over mobile data is often poorer compared to desktop.
So try to make all your above-the-fold content text-based and reserve images for below-the-fold.
Implement Lazy Loading
Along similar lines, use lazy loading for images. It’s a technique to speed up page load speed by deferring the initialization of “non-critical” elements until the moment of need.
Use WebP Images
A Google initiative that the search giant defines as “a modern image format that provides superior lossless and lossy compression for images on the web. Using WebP, webmasters and web developers can create smaller, richer images that make the web faster.”
WebP lossless images are 26% smaller in size compared to PNGs. The format arrived on the scene over a decade ago but has only recently picked up due to the greater need for speed. It has widespread support so you can switch to WebP as your primary image file format.
Optimize Image File Sizes
Last but not least, this is a basic tactic that most webmasters already use today. Use image compression tools to ensure your image files are small in size while still maintaining quality. Also, ensure you define image dimensions to prevent layout shift.
CSS optimization
CSS is an integral part of any modern website’s code. So making sure your CSS code is optimized for performance is key, and here are four quick tips to do that.
Inline Critical CSS
Having all your CSS inline is great, but in particular, make sure to inline CSS that is critical to the overall design and layout of your page.
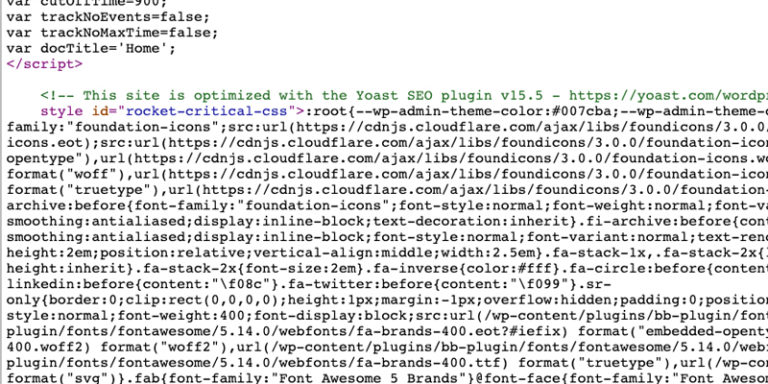
This reduces the number of individual files a browser needs to request from your server to load the initial layout and paint the initial content of your page.
Minify CSS
This one’s straightforward — run your CSS code through a minifier tool that removes all excess whitespace, comments, etc. that has a small-yet-tangible effect on page load speeds.
Consolidate CSS Files and Code
It may be easier to store CSS in a variety of files and have it distributed throughout your code, but for better page load speeds, you must consolidate your CSS, both inline and in separate files, to execute specific elements as necessary.
Optimize CSS Delivery
Conventional website design loads the framework for the site, then the content, and then the CSS to format it all. When CSS is stored in an external file, this can delay loading substantially.
Google recommends preloading CSS files to have the browser load the CSS and have it ready exactly when it’s needed.
JavaScript optimization
JavaScript can have one of the biggest impacts on delays in page load. Here are a few ways to optimize your JavaScript.
Minify JS Scripts
As with CSS, your JS code works just as fine without extra spaces, comments, and complex variable names. So use a minifier tool to compress your JavaScript.
Consolidate Scripts and Minimize Usage
Often, there are use cases where features in HTML5 and CSS3 can suffice and you can avoid using JavaScript. So review your old website code to find and eliminate as much JavaScript as you can from your pages.
Defer or Async Scripts Whenever Possible
When a browser has to render JavaScript, it has to process all that script before it can continue loading the page. As many developers insert scripts in page headers, it delays page loading considerably.
Try deferring scripts to let the browser continue loading the page before executing the script, or use async to enable simultaneous loading.
Remove jQuery Migrate
Conduct an audit of your website (in particular, look at old plugins and apps) to see if you’re using jQuery Migrate. If so, try to update or replace those plugins. The Migrate module is best removed completely as it’s bulky and can drastically slow down your site.
Use Google Hosted JS Whenever Possible
Google hosts an array of standard JS libraries you can use for your website. Instead of using a third party for those libraries or hosting them yourself, use Google’s versions for optimal load times.
In fact, heavy or unused JavaScript (and CSS) is a common problem that leads to poor CWV scores.
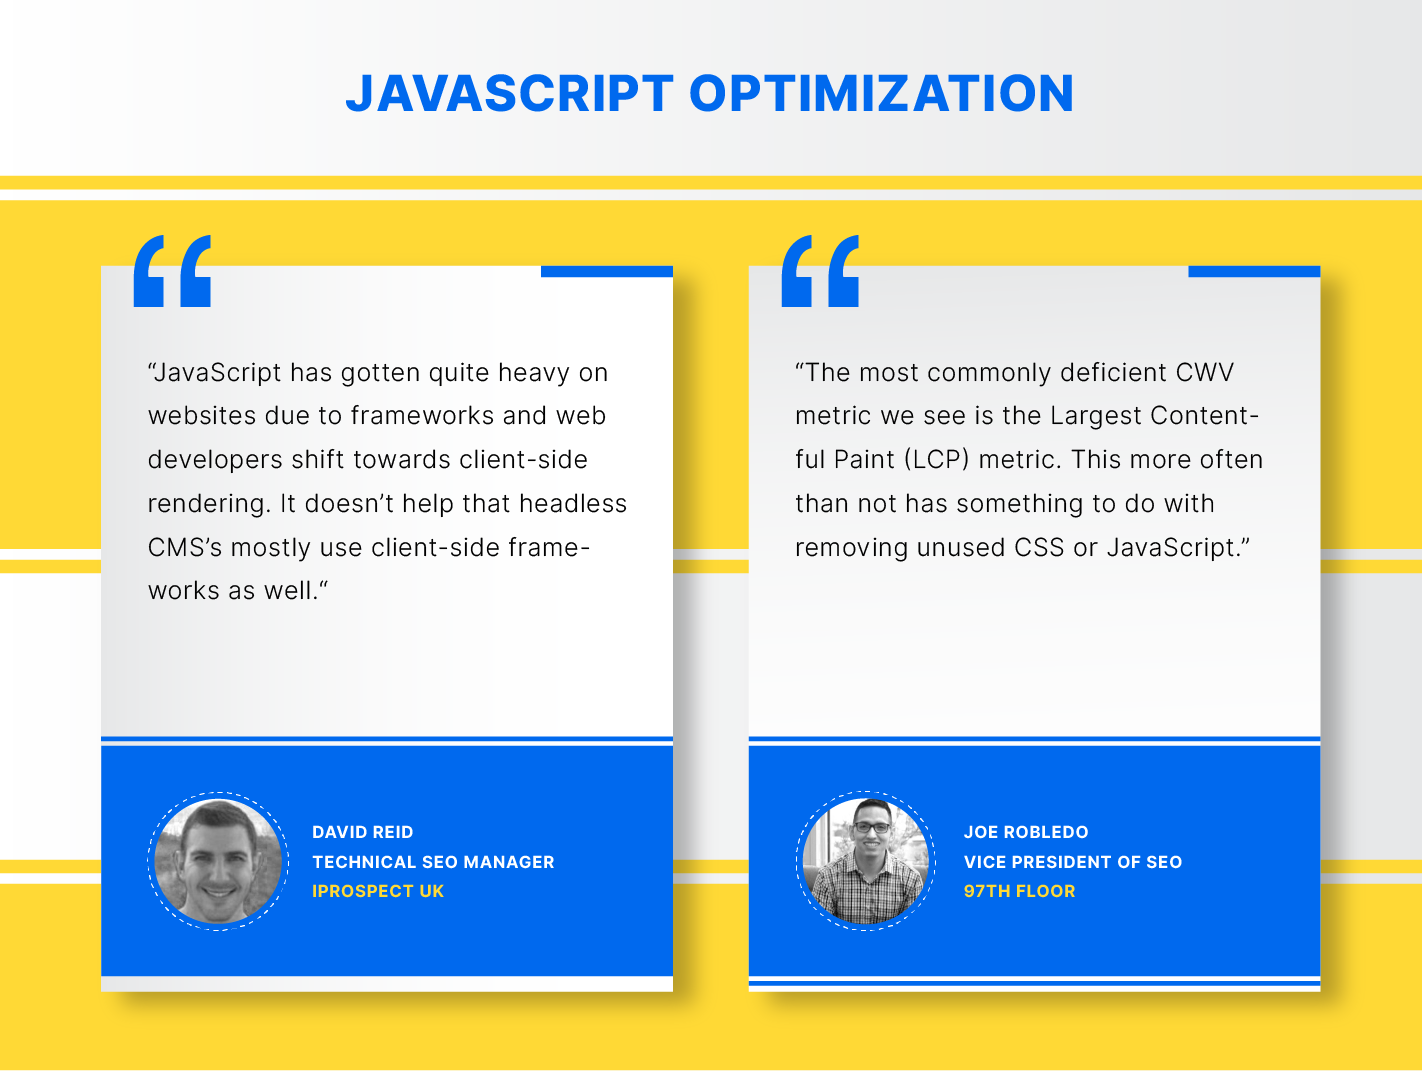
“JavaScript has gotten quite heavy on websites due to frameworks and web developers shift towards client-side rendering. It doesn’t help that headless CMS’s mostly use client-side frameworks as well. Common issues often stem from cookie policies causing large CLS scores to excessive JS that needs to be refactored and called more efficiently in the first place to improve LCP,” explains David Reid, Technical SEO Manager at iProspect UK.
“The most commonly deficient CWV metric we see is the Largest Contentful Paint (LCP) metric. This is more often than not has something to do with removing unused CSS or JavaScript. This is especially true for clients who have their site built on CMS platforms that are more restrictive with how much you can change the backend of the site’s build,” says Joe Robledo, Vice President of SEO at 97th Floor.
Video optimization
Videos are great for marketing purposes and user engagement, but even with partial loading and buffering, they can get heavy to load. Use the following couple of tactics to optimize your videos for speed.
Use Image Placeholders for Video Thumbnails
Many users don’t wish to watch videos on your website, so forcing autoplay videos or having them load in the background is a bad idea. Instead, use an image placeholder where the video would normally load, as the image loads faster and looks like the video player with a thumbnail.
When a user hits the image, it triggers the video load and doesn’t require the loading of the video file until that point.
Minimize Videos Above the Fold
Similar to the case of images, video files are typically bulky, and having them load above the fold is a surefire delay in your content paint. So have your videos below the fold. Visitors would anyway want to read a title and introduction before they hit play.
Font and icon optimization
Fonts and icons may seem like minor details, but optimizing them can make a notable impact. Here are three ways to do just that.
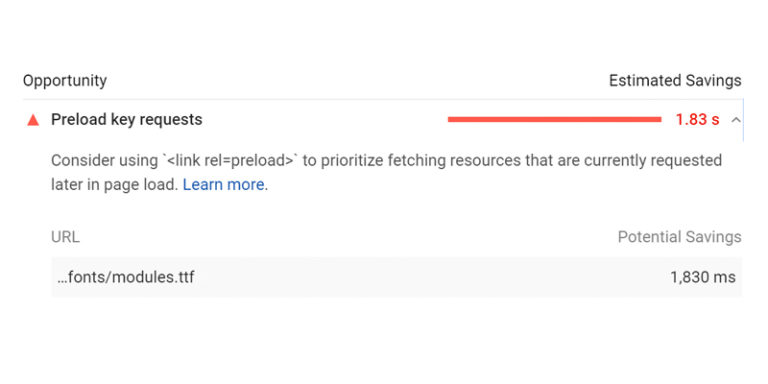
Preload Fonts
As with scripts, when a browser calls for a font load, loading that font takes precedence and stops the rest of the page from rendering. Use a preload command to load the font beforehand and boost page load speed.
Only Use Fonts You Need
Many web fonts and font families load their entire character sets and stylesheets when called, even if your page doesn’t use the majority of it. So if you’re using a very limited amount of a particular font, or a font with large character sets included, consider paying for premium font access.
Mark Davoli suggests “optimizing font loading is one of the easier fixes users can do to improve Core Web Vitals. If you can reduce the number of fonts loading to two or three with minimal variants and weights you can net a significant improvement. This in combination with preloading fonts in use above the fold can be an easy win.”
Use SVG Whenever Possible
Scalable Vector Graphics (SVG) is a markup language for creating two-dimensional graphics and images of small size with interactivity. These can be scaled almost indefinitely than conventional icons and are much smaller in size, so consider using SVGs whenever possible.
Additional optimization
Here are a few miscellaneous optimizations you can make to your website, if applicable.
Minimize Third-Party Scripts
User engagement tools and plugins (such as social sharing buttons) are helpful, but they need to execute third-party scripts that can dramatically slow down your site. So try to minimize using third-party plugins and find the fastest versions of each.
Avoid Pre-Load Filler
Some websites use a splash screen wherein they display a spinner loading icon or animation which reassures the user that the page is indeed loading. This may work to reduce bounces but can seriously hurt your CWV. So it’s best to avoid all such pre-load filler content and focus on speeding up your website so you don’t need them.
Consider a Site Redesign
If your existing website has an archaic design with bloated code, it’s worth considering a complete redesign. It may actually be easier to come up with a new, speed-focused design than to keep tweaking countless elements of an old website.
Understanding Field Data vs. Lab Data
When you talk about Web Vitals, there are two types of data: field data and lab data.
Field data is data gathered from real users with their unique network connections, devices, caching, etc. collected via the Chrome User Experience Report aka CrUX. Whereas lab data is collected in a controlled environment with a predefined device and network connection.
Understanding this difference is important as you may be achieving great scores in Lighthouse (lab data) but your actual users might be having a poor UX (field data).
Field data may not be available for your pages that aren’t getting enough visitors and is less useful for debugging as you have to wait for new CrUX data to update after you make changes. Furthermore, it may include data from countries or markets you’re not catering to.
Lab data doesn’t include user interaction data and is simulated, so it produces reproducible results with predefined hardware and settings.
Here’s a table that summarizes which Web Vitals are available in each type of data.
| Web Vital | Field data | Lab data |
| Largest Contentful Paint (LCP) | ✅ | ✅ |
| First Input Delay (FID) | ✅ | ❌ |
| Cumulative Layout Shift (CLS) | ✅ | ✅ |
| Total Blocking Time (TBT) | ❌ | ✅ |
| First Contentful Paint (FCP) | ✅ | ✅ |
| Speed Index (SI) | ✅ | ✅ |
| Time to Interactive (TTI) | ❌ | ✅ |
And here’s a table that summarizes the basic differences between the two types of data.
| Web Vital | Field data | Lab data |
| Data origin | Real users | Simulated user |
| Data freshness | Collected in the last 28 days | Collected in real-time |
| Device | Unique to each user | One device (default: Moto G4) |
| Network Connection | Unique, across all users | One network connection speed (default: fast 3G) |
| Locations | Unique, across all users | One location |
| Purpose | Gain insight into real user experiences | Debug and test |
How to Analyse Your Core Web Vitals With JetOctopus
Web Vitals are largely technical SEO-based performance metrics, which means having a powerful technical SEO toolkit in your arsenal is a must.
JetOctopus is a visual technical SEO toolkit meant to simplify technical SEO for websites big and small. It helps you monitor and improves the SEO health (from crawling and indexation to logs and content analysis) of your business website.
You get a big picture overview of your website’s page speed issues in the form of easy-to-understand visuals so you can readily prioritize the best optimization opportunities without delay.
You can audit your whole website in three easy steps, and the page speed data will be fetched directly from Google. These results are present in a way that you can easily find the elements that need the most attention (e.g. see FCP in the chart below):
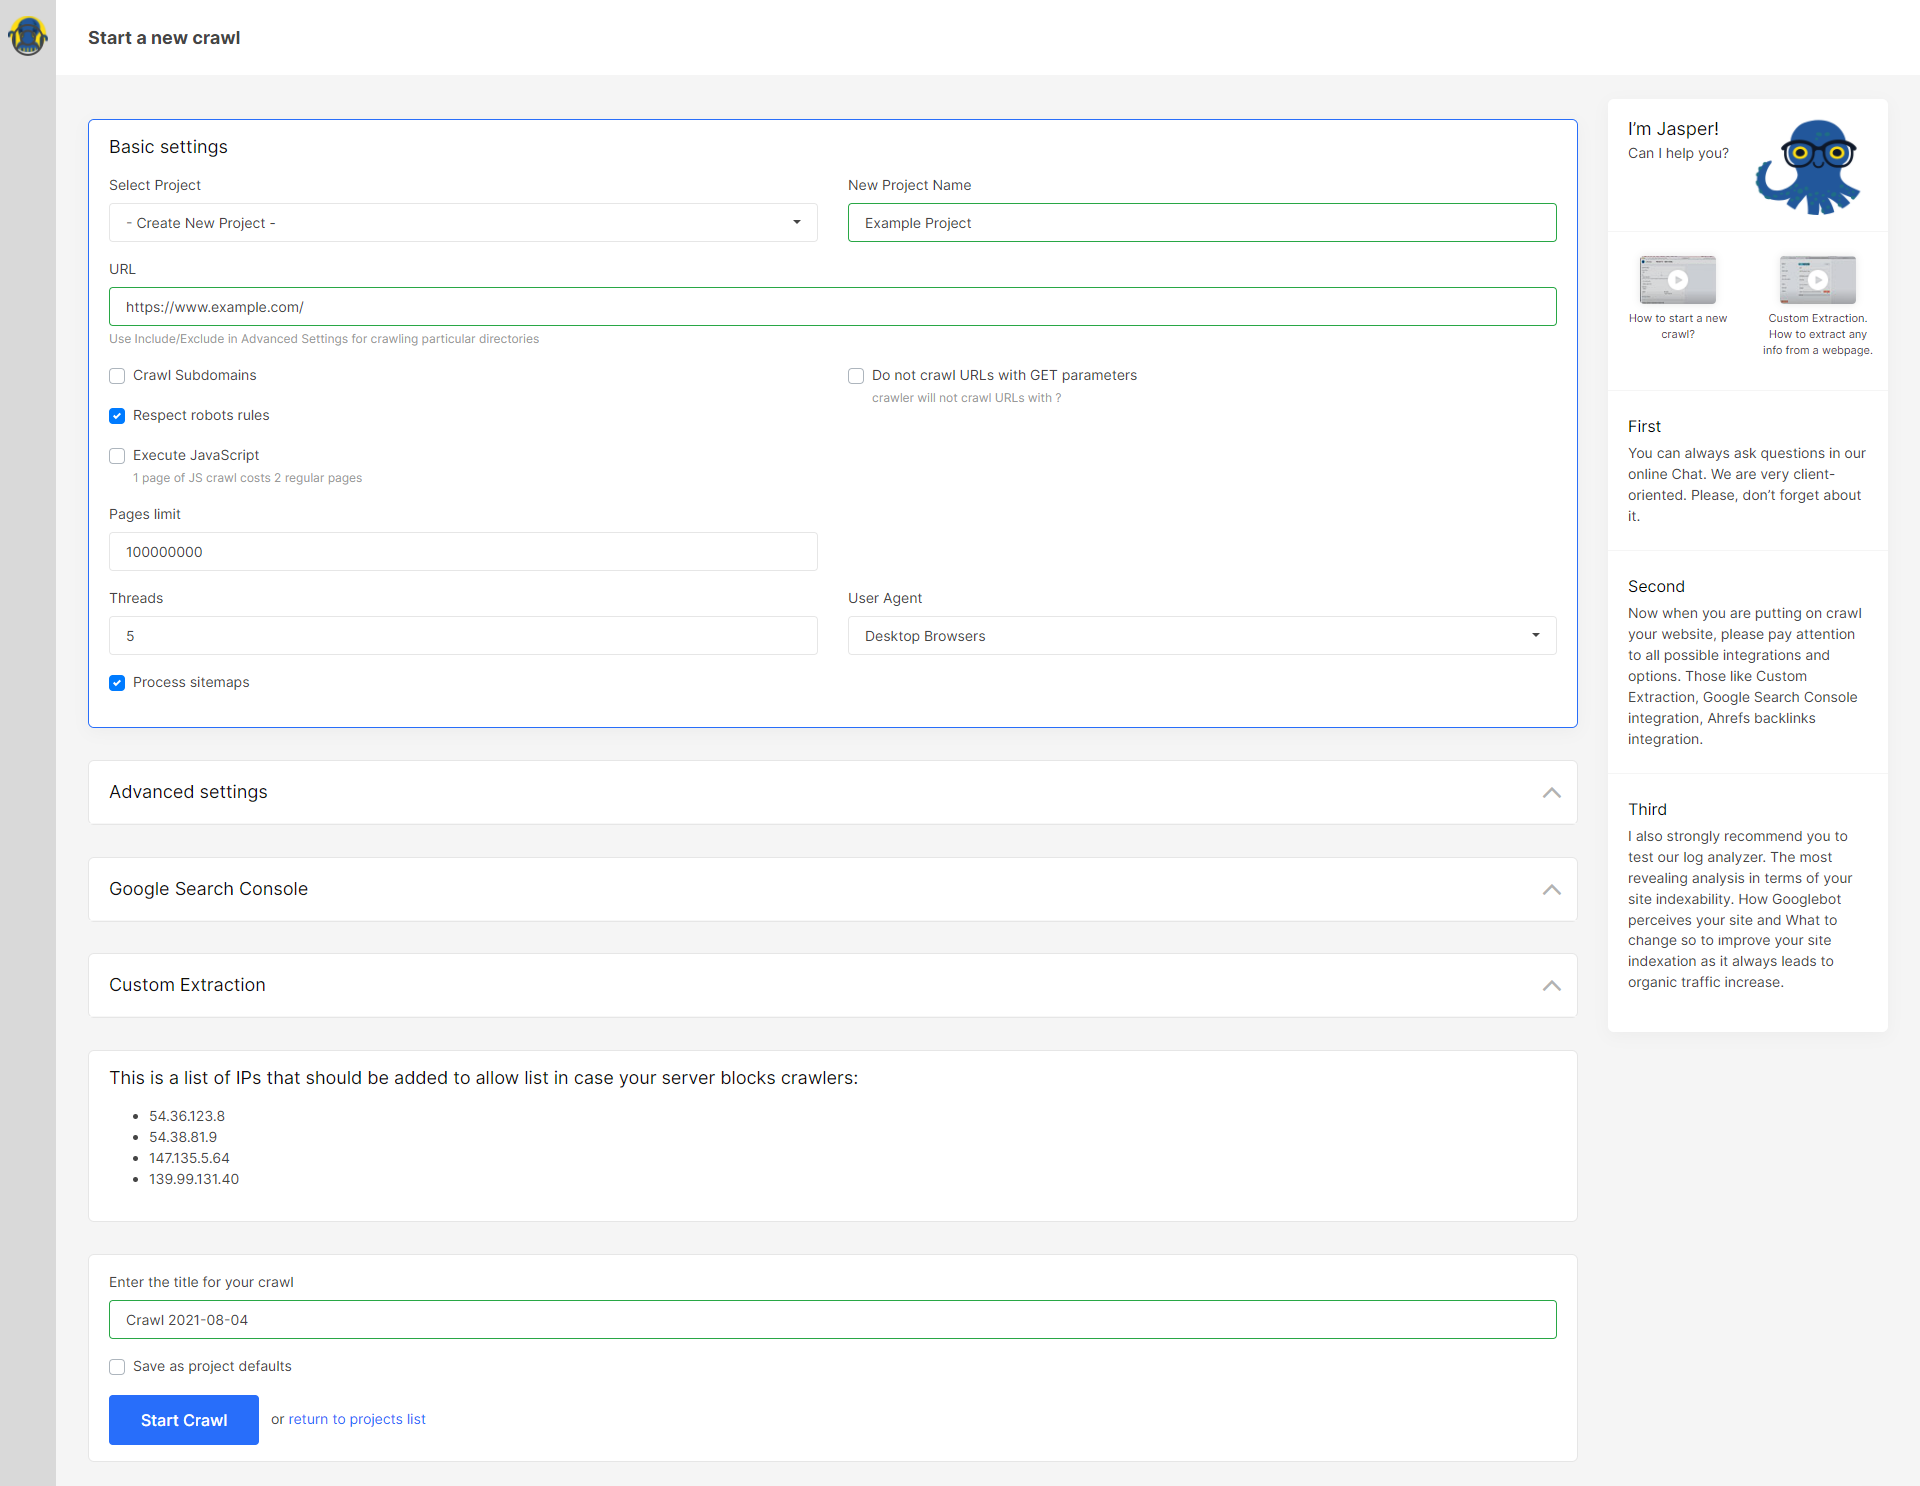
Step 1: Crawl Your Website in JetOctopus
Click “New Crawl” on the homepage dashboard.
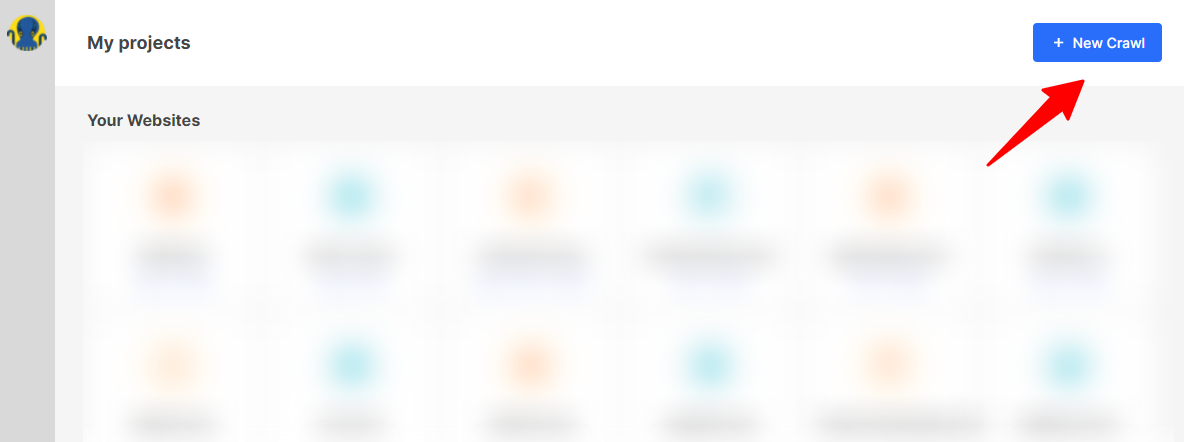
Add details about your project as per your requirements.
Step 2: Setup Your Google PageSpeed API Key
After crawling is complete, head over to the “Page Speed” by clicking the Crawler icon in the sidebar.

When you click on Settings you will be taken to the below page.
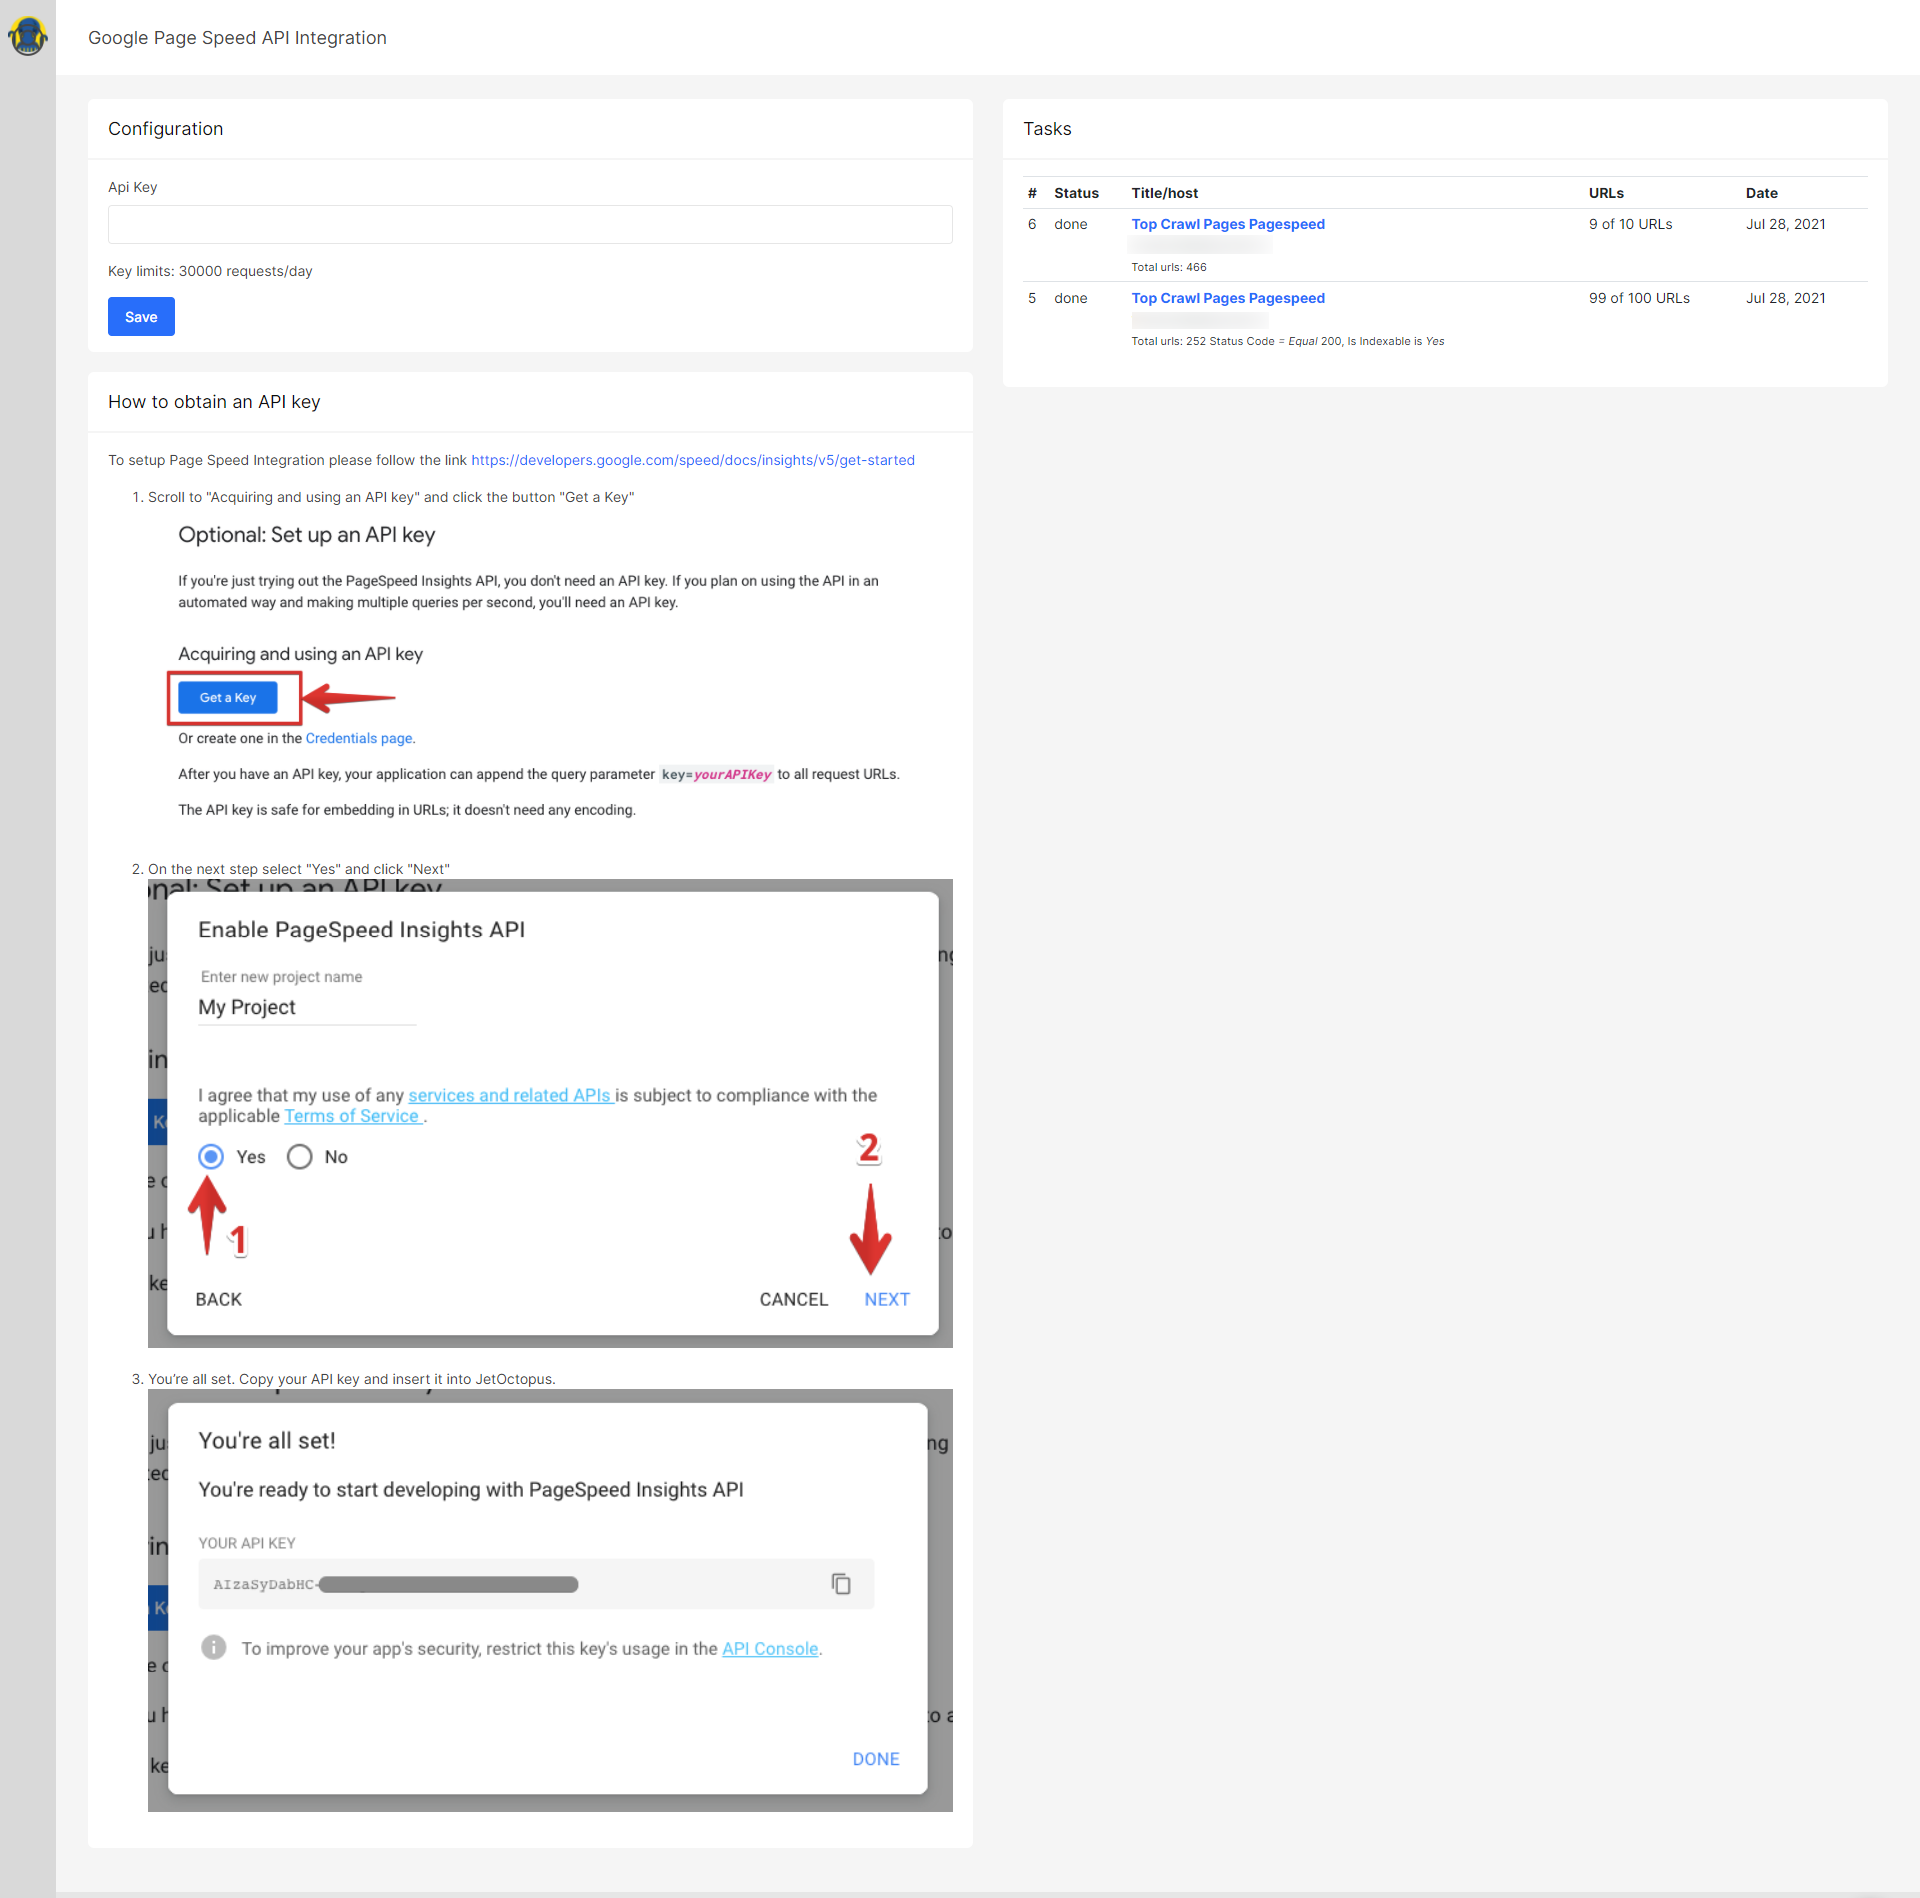
Get your API Key as shown, then add that key for configuration and it is ready to scan pages.
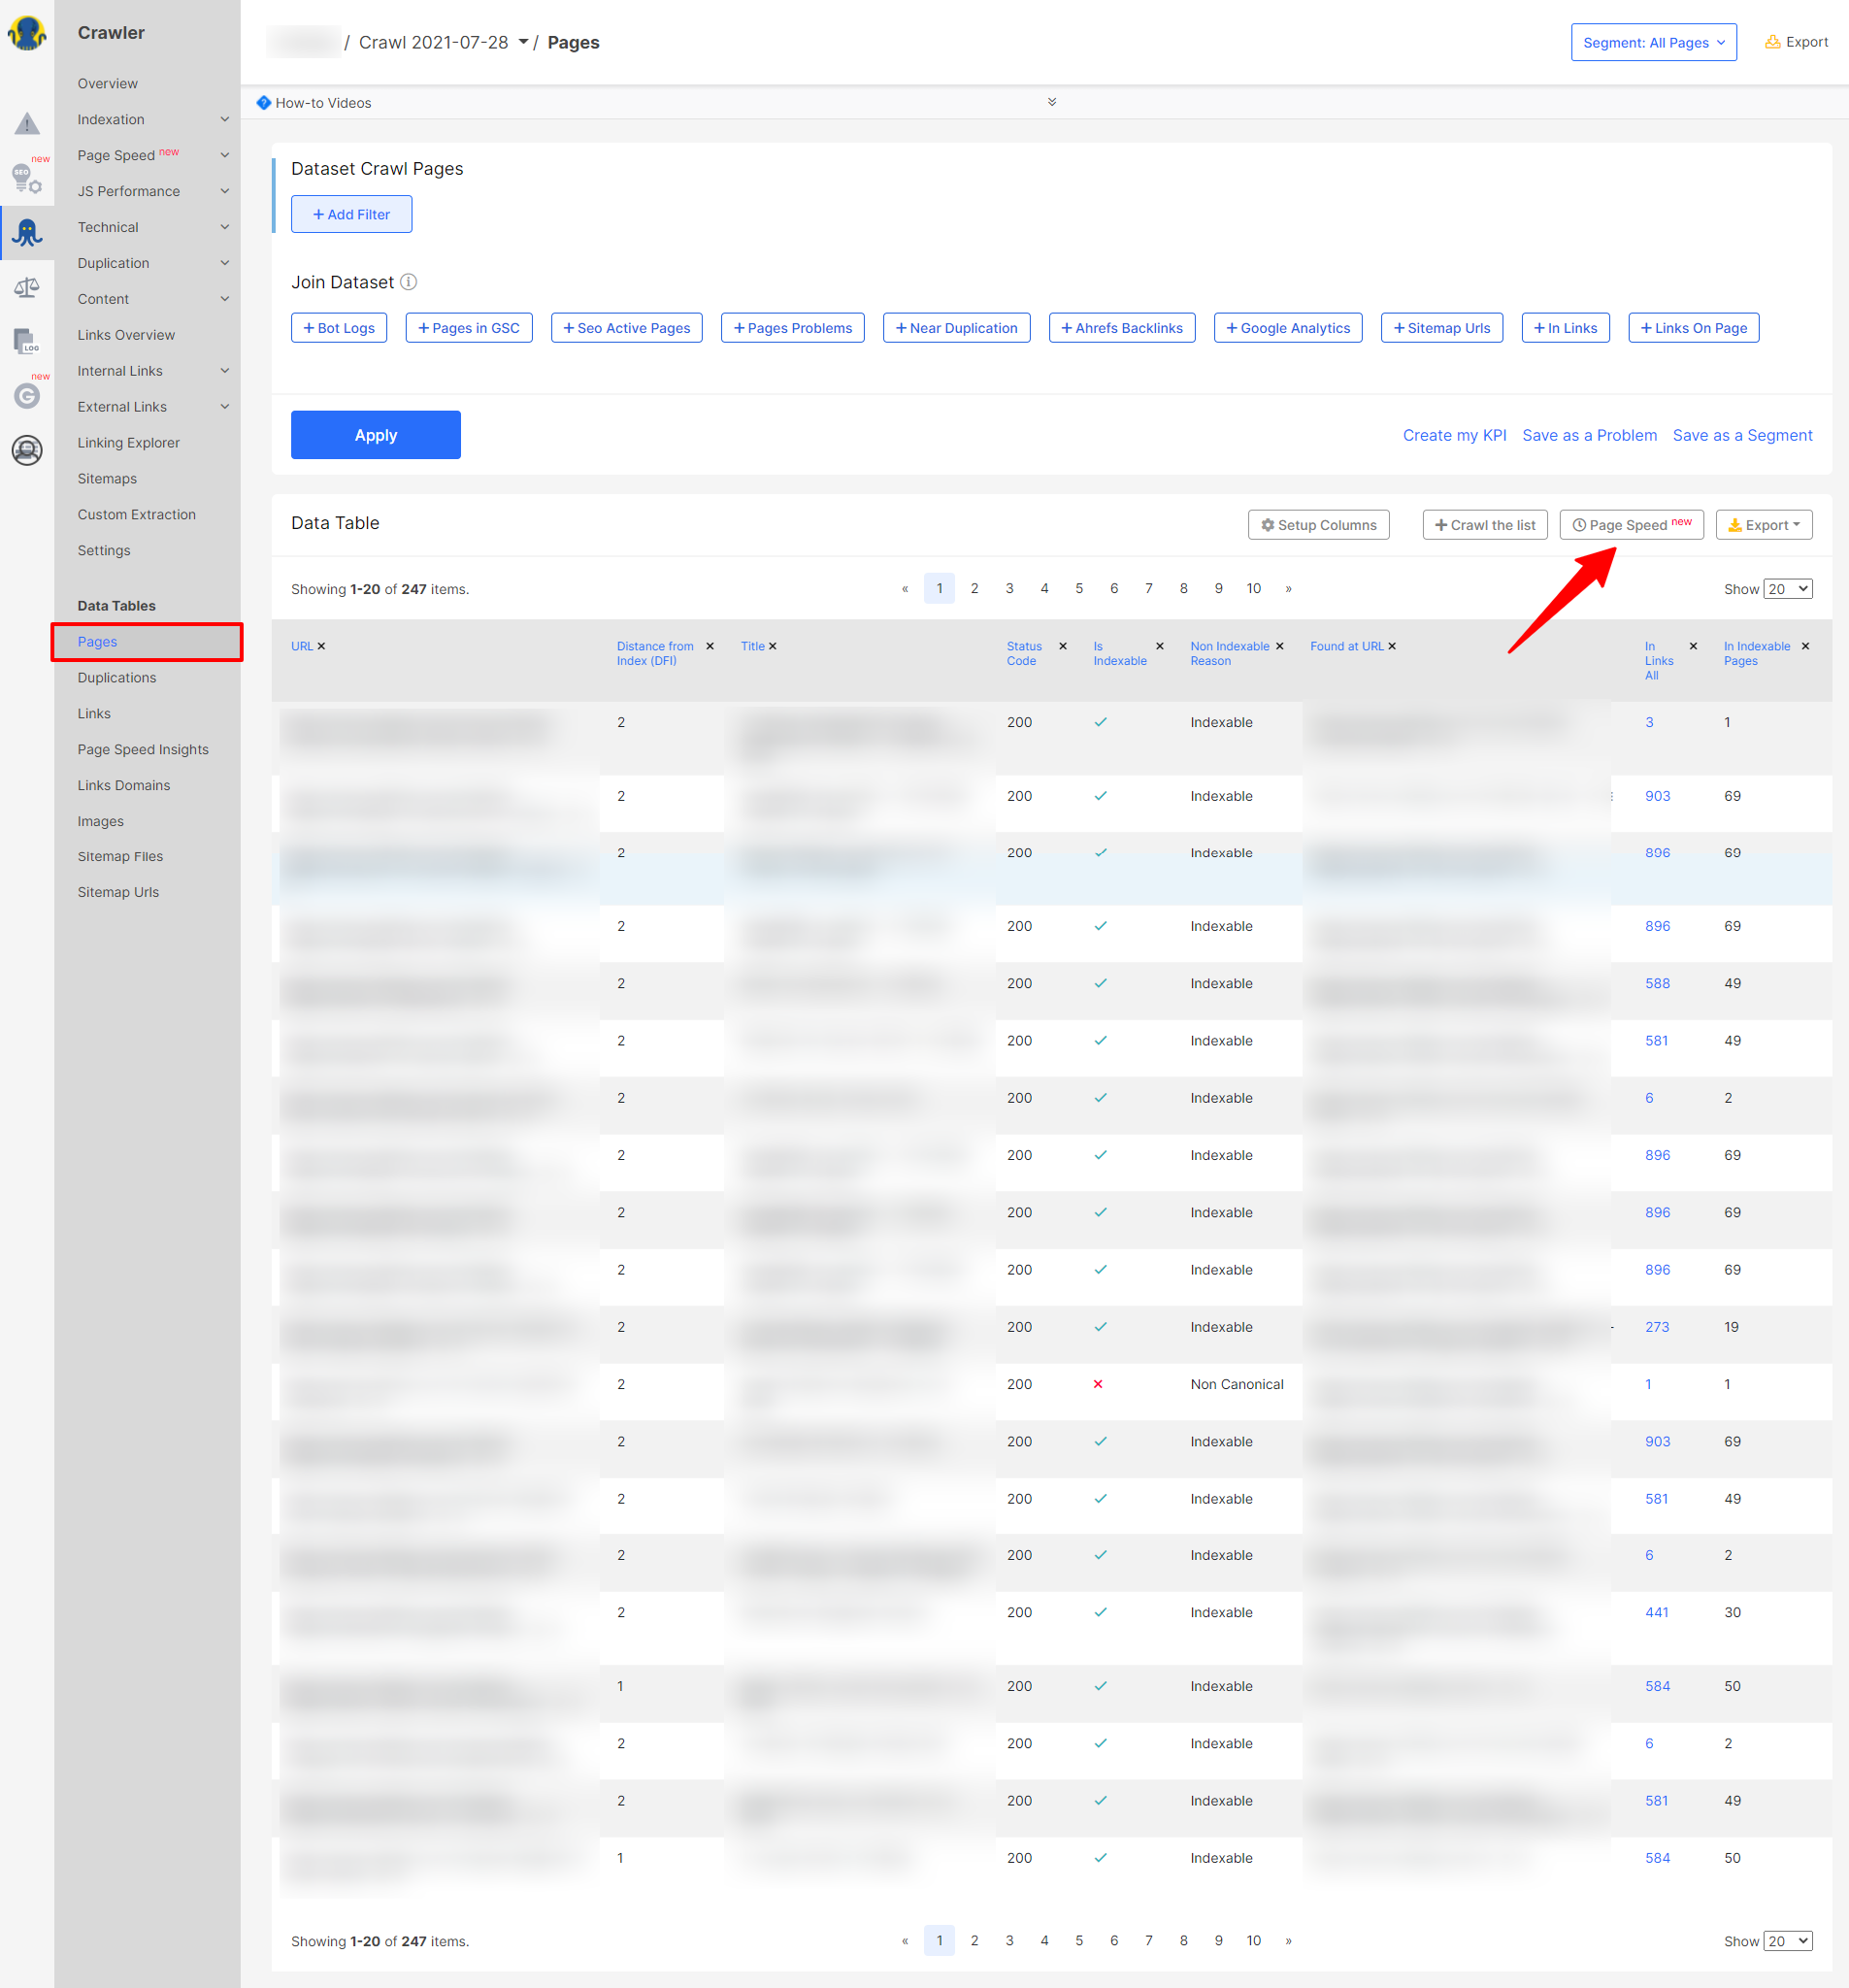
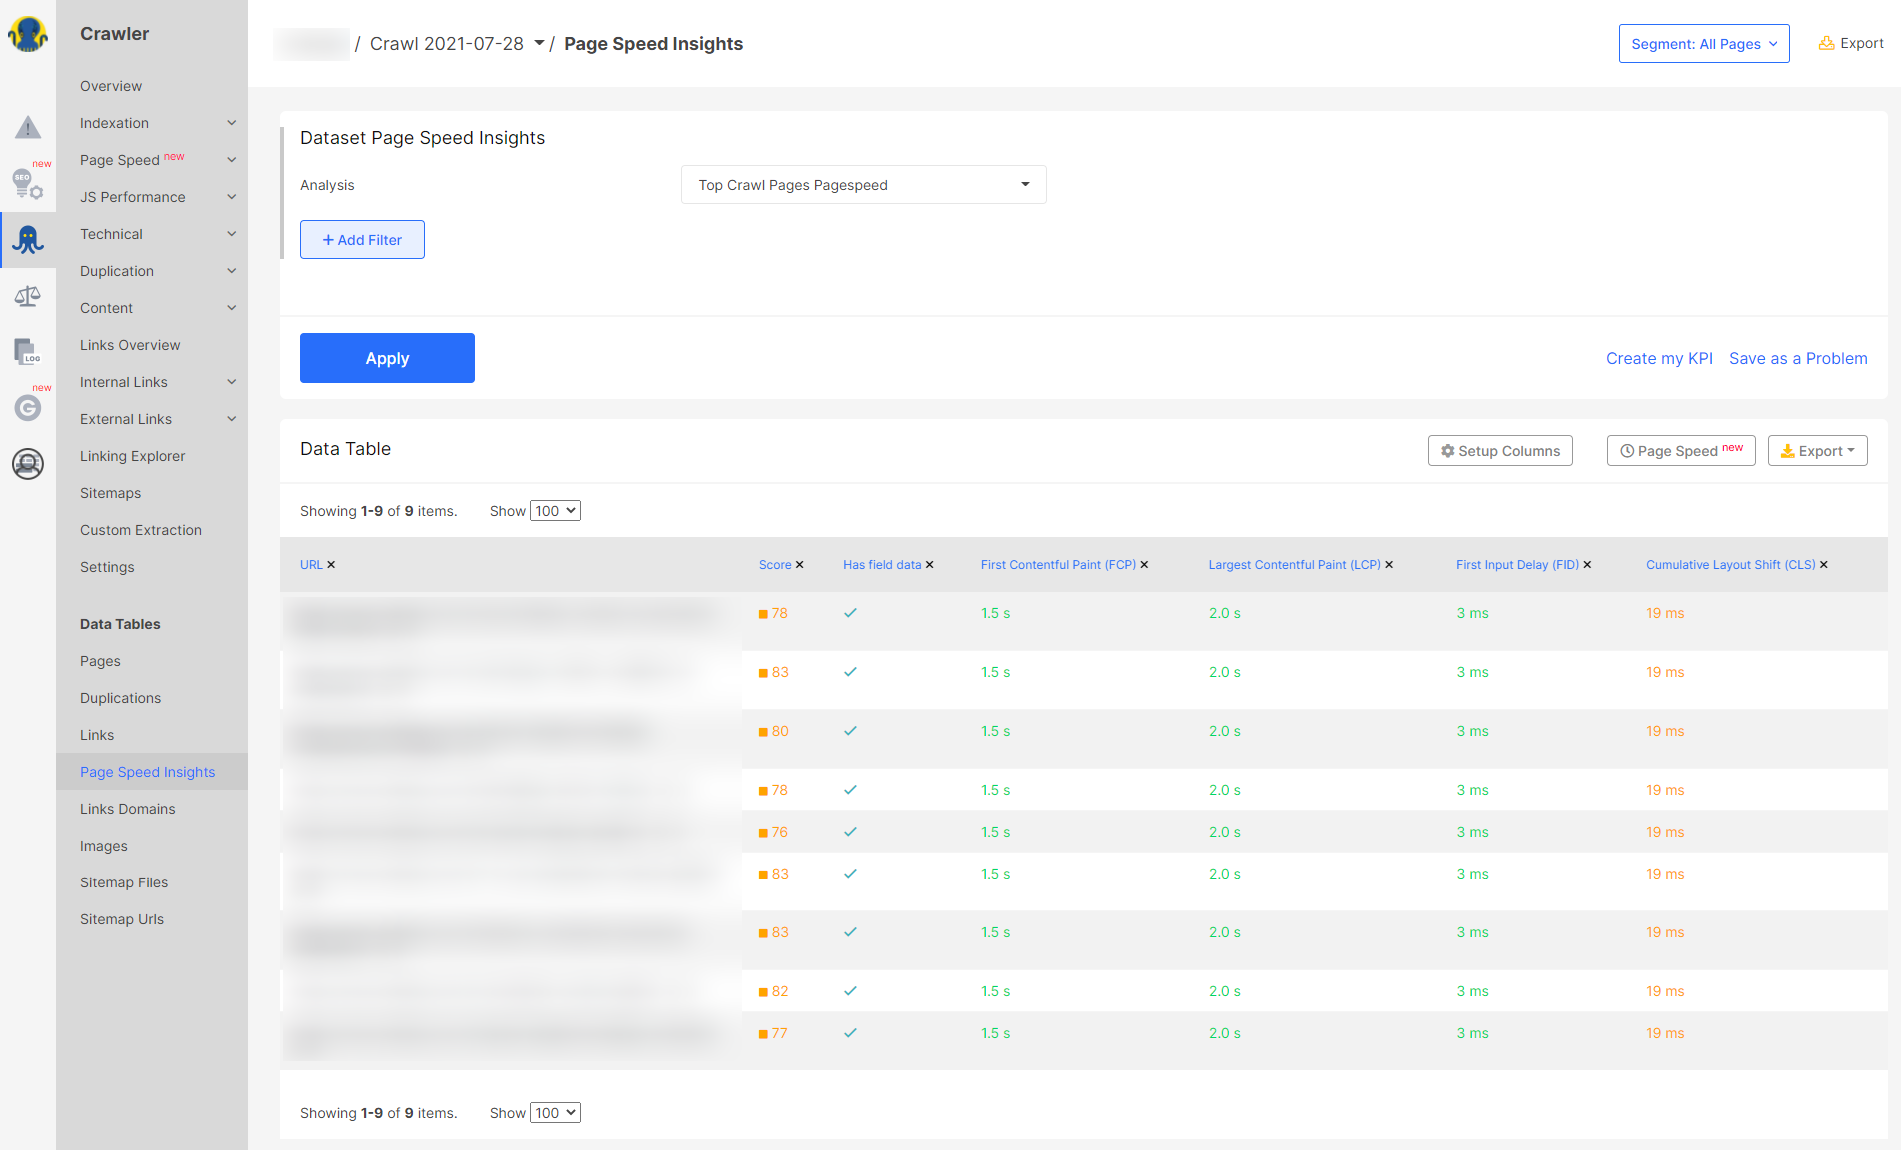
Step 3: Start Page Speed Analysis in the Data Tables
Here you can choose which data you want to analyze with the Page Speed tool.
When you will click on “Page Speed”, you will see reports of each analysis.
Now, head over to Page Speed Overview, here you will see total pages, average score, score breakdown, lab data and field data of the last 28 days in visual charts.
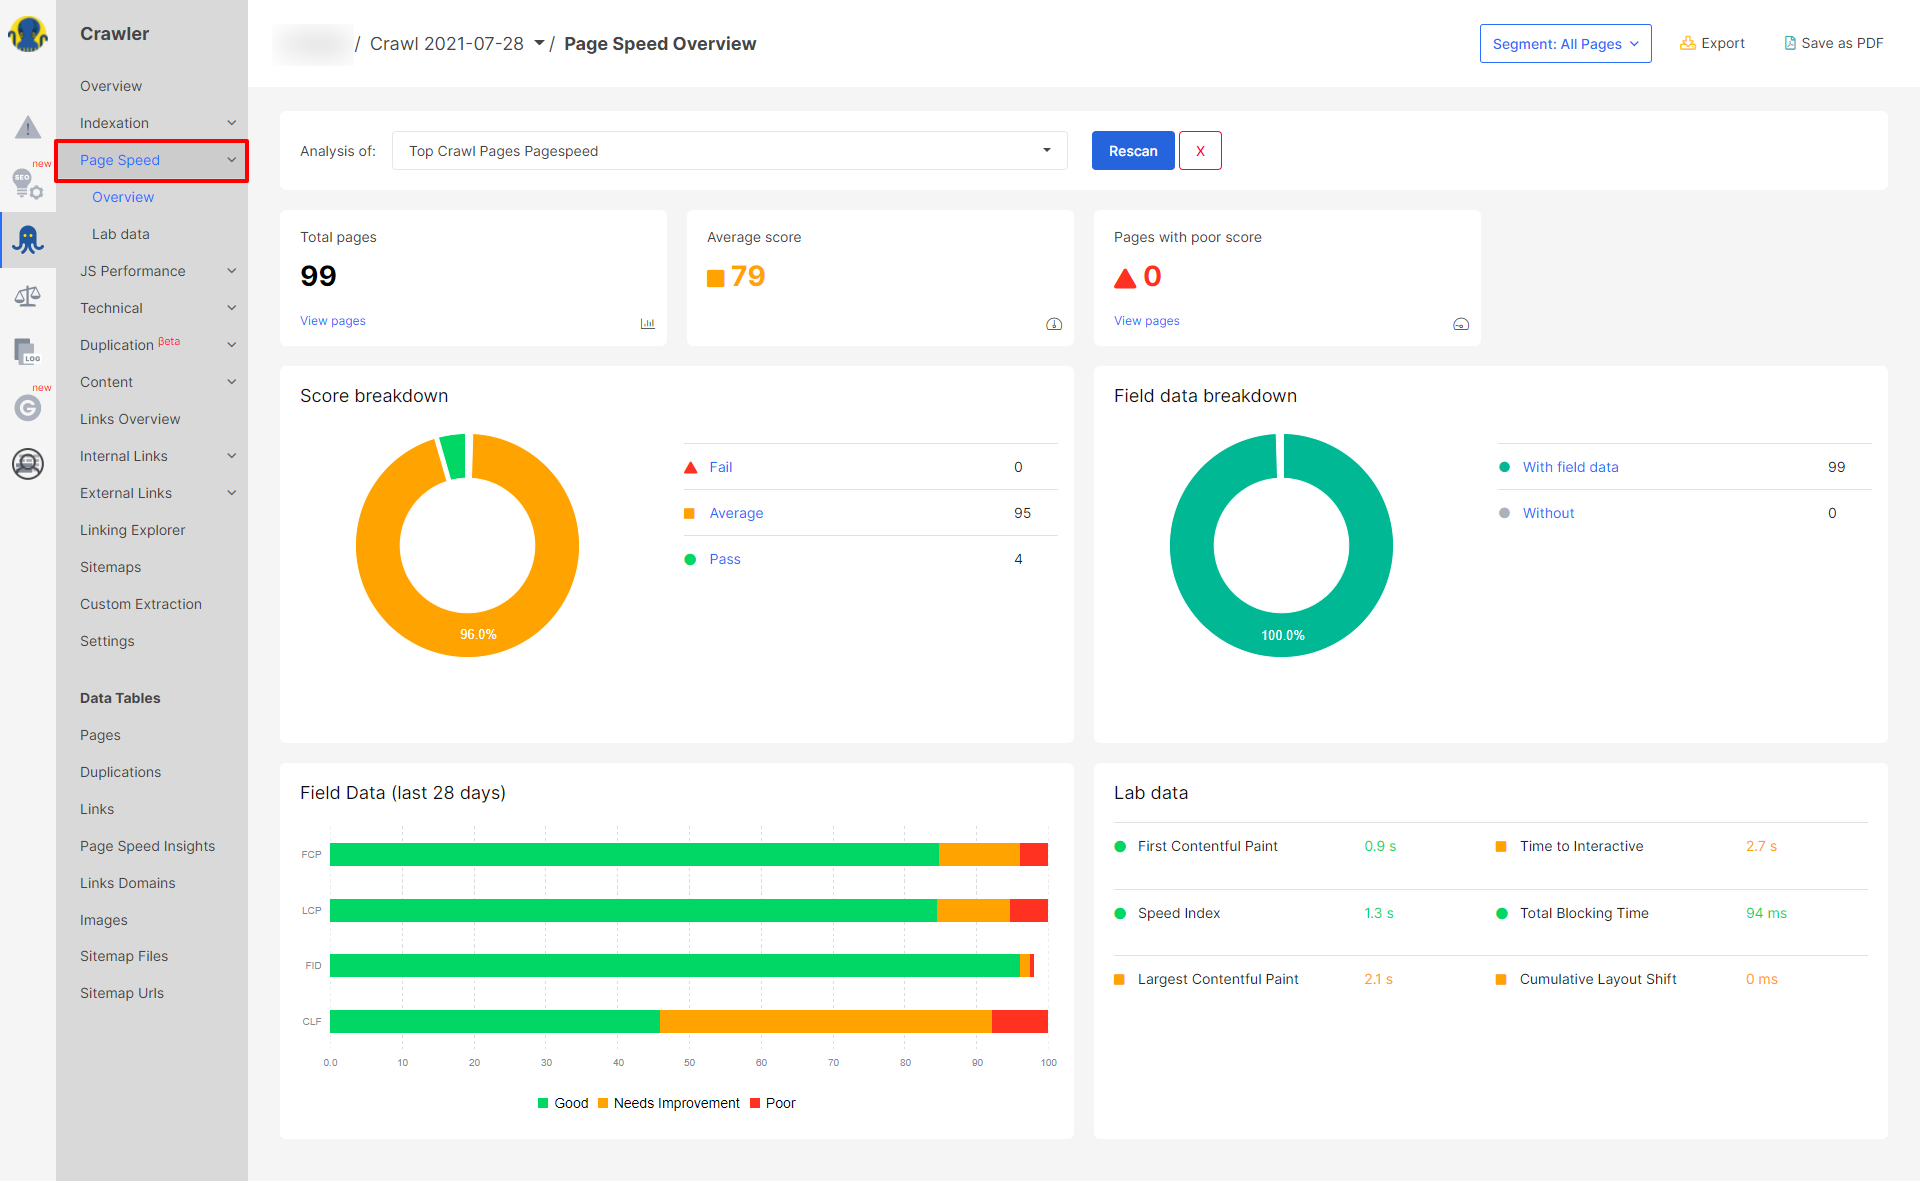
Click on “Lab Data” of Page Speed to get individual data for First Contentful Paint (FCP), Total Blocking Time (TBT), Largest Contentful Paint (LCP), Cumulative Layout Shift (CLS), Speed Index (SI), Time to Interactive (TTI).
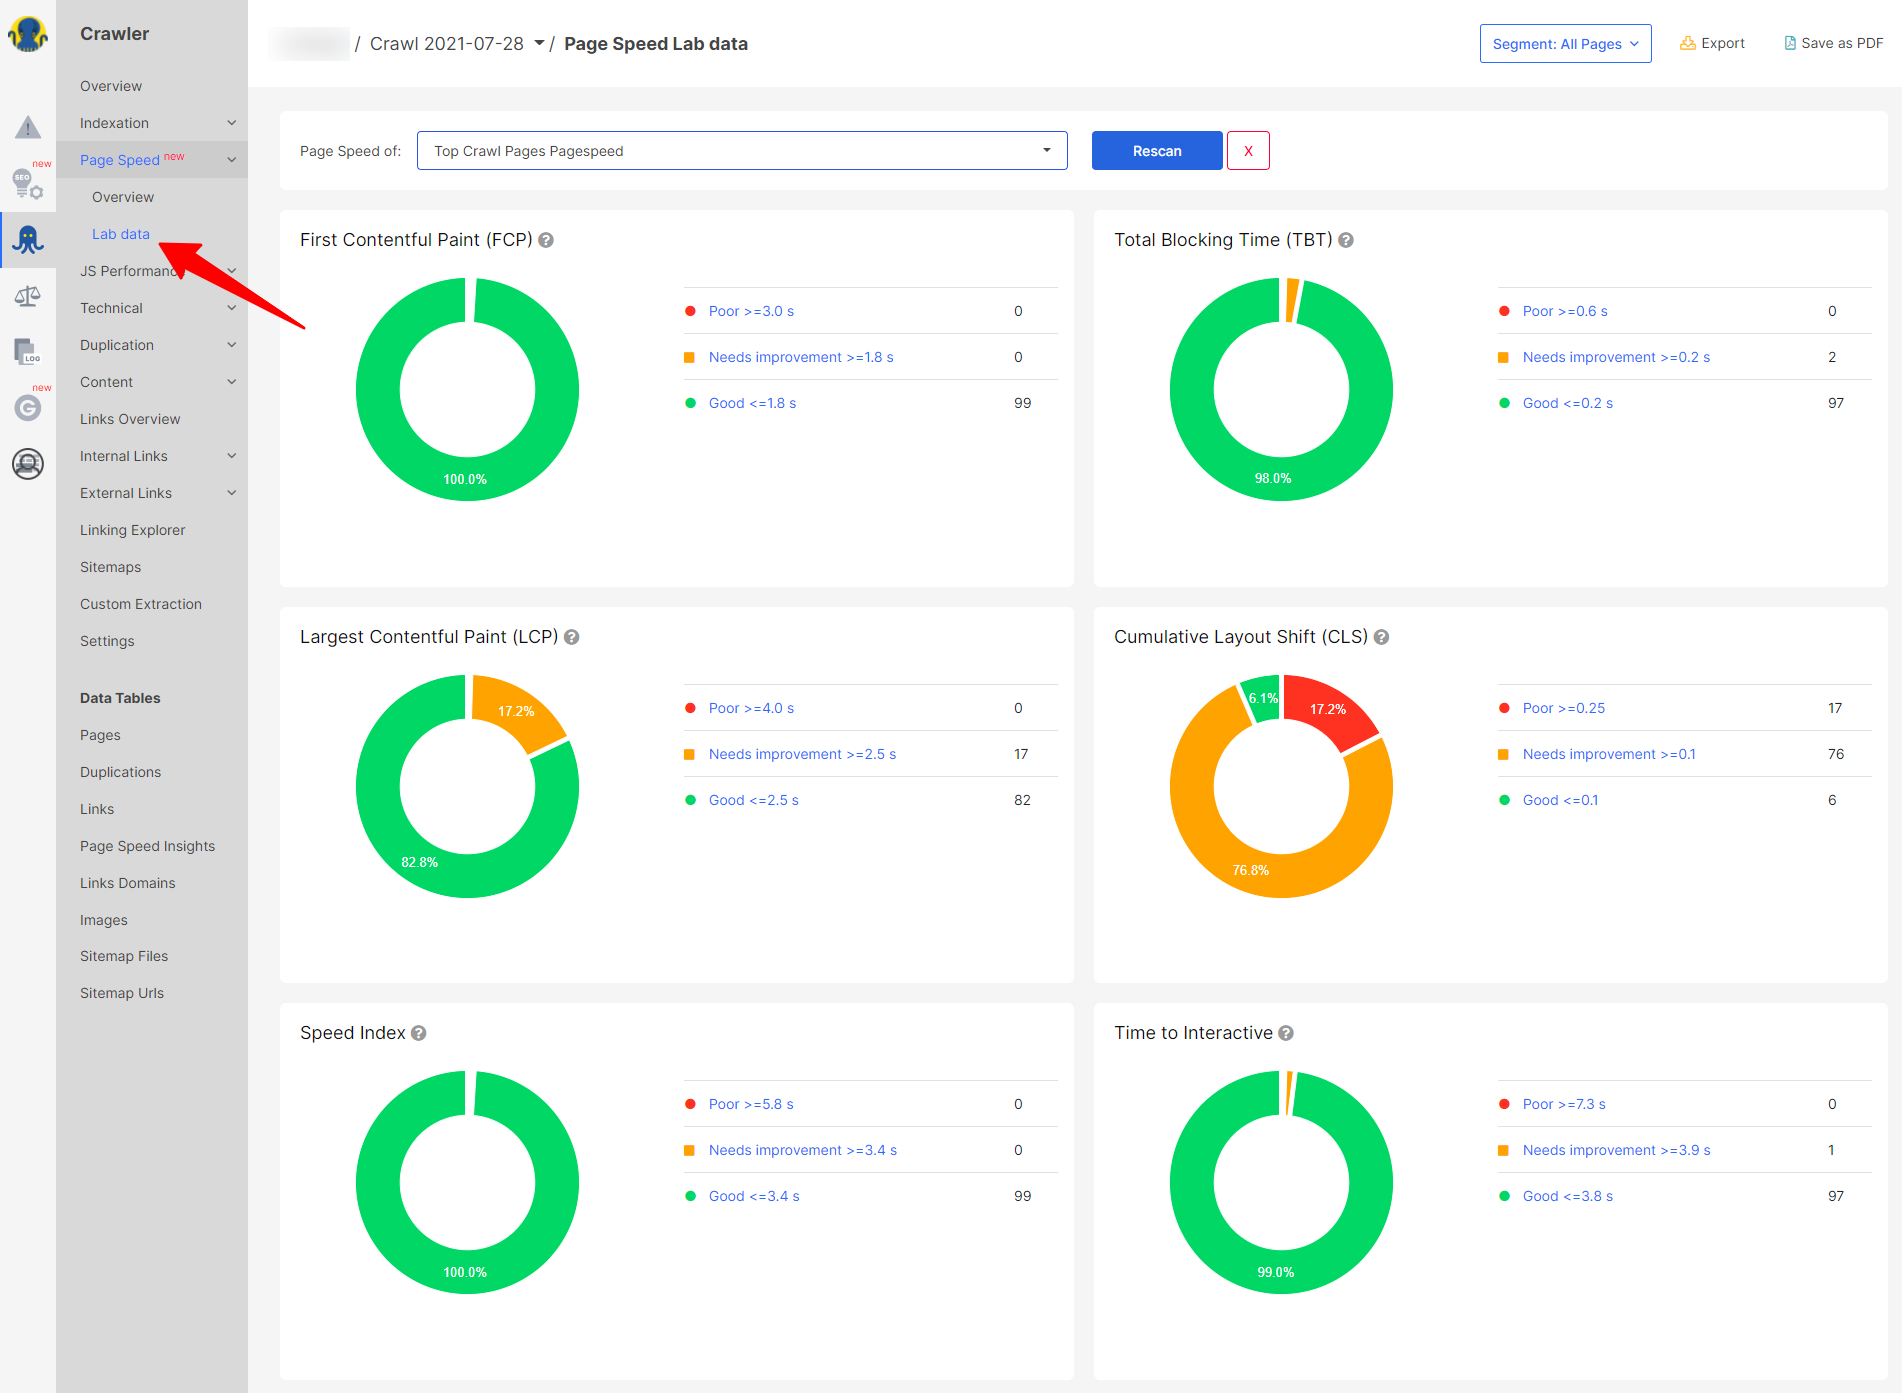
By clicking on relevant pie-chart segments, you can check affected URLs with scores for each of the web vitals.
Video with Step by Step Instructions
With user-friendly dashboards and comprehensive SEO reports, JetOctopus is one of the fastest (up to 250 pages per second), most cost-effective website crawlers and logs analyzer software you’ll find.
Start your 7-day full-featured free trial today!
Other Tools to Measure your Core Web Vitals
With the difference between field data and lab data clear, along with a clear understanding of the CWV metrics and their optimization, let’s look at some of the top tools you can use to measure and improve your CWV.
PageSpeed Insights
PageSpeed Insights (PSI) reports on the lab and field performance of a website on both mobile and desktop. It gives an overview of how real-world users experience a page (powered by the Chrome UX Report) and a set of actionable recommendations to improve your site’s performance and page experience (provided by Lighthouse).
You submit a URL, and the tool pulls up field data, collects lab data by running Lighthouse, and finally suggests improvements under “Opportunities” and “Diagnostics.”
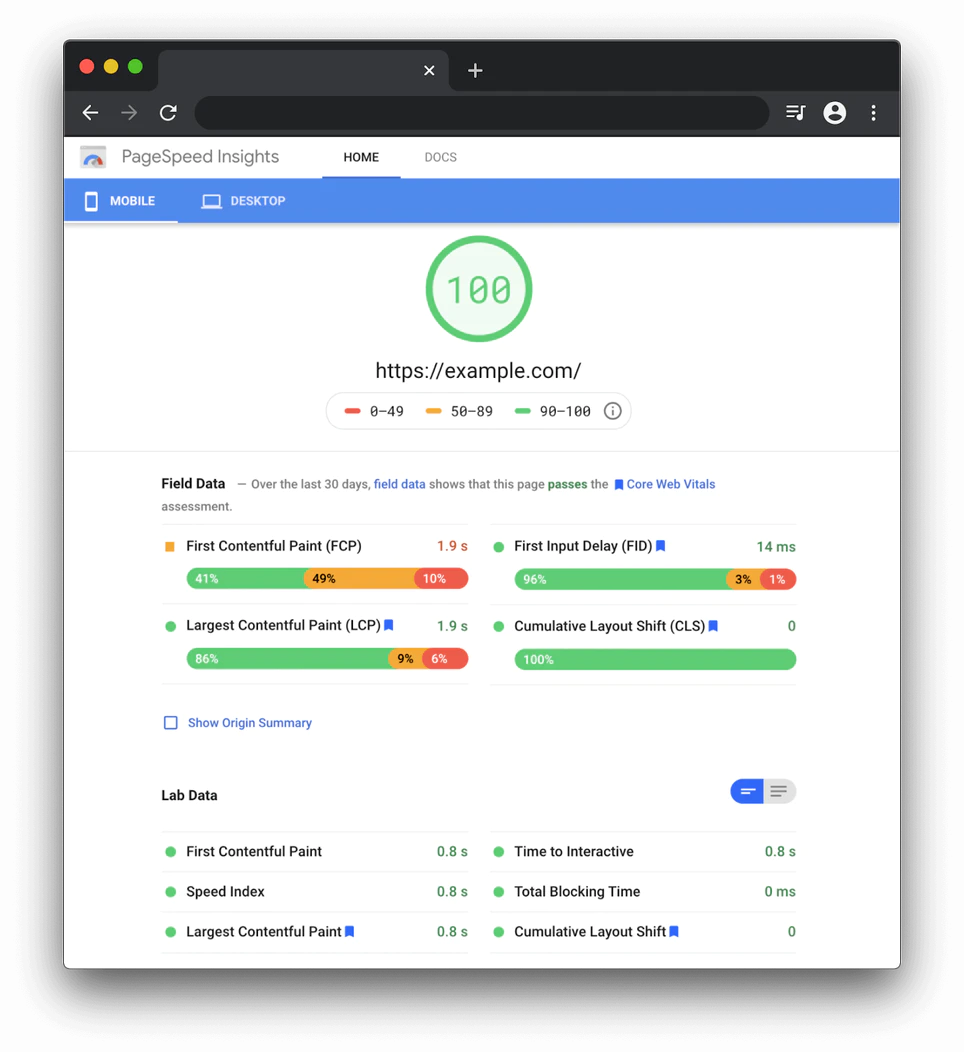
While GSC shows you a neat list of pages that need attention, PSI identifies per-page opportunities to improve page experience. In PSI, you can clearly see whether your page meets the thresholds for a good experience across all CWV metrics at the top of the report.
Lighthouse
Lighthouse is an automated website auditing tool that helps developers diagnose issues and identify opportunities to improve their website UX. It evaluates various aspects of UX quality in a lab environment, such as performance and accessibility.
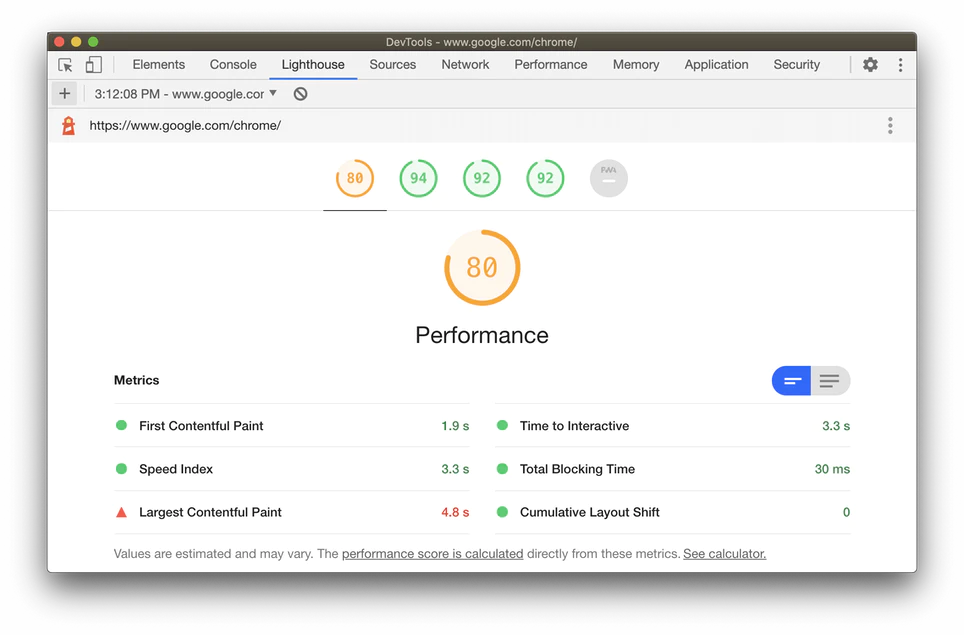
The latest version of Lighthouse includes additional audits, new metrics, and a newly composed performance score based on lab data. The score is a value on a scale from 4 (extremely poor) to 100 (excellent). It’s a weighted average of the Web Vitals’ metric scores, and the scores are all weighted differently.
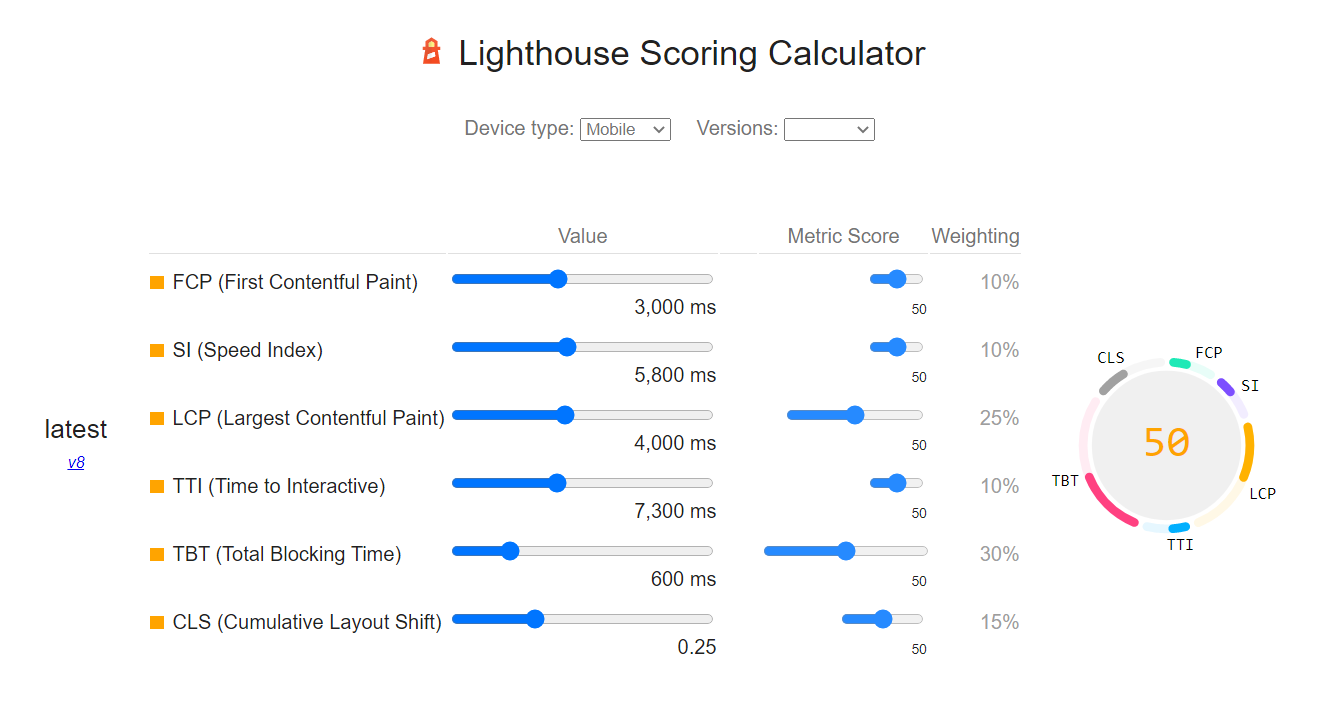
Following the recommendations in the Lighthouse report and optimizing for your scores helps you provide the best possible experience to your users.
web.dev Measure
This tool lets you track the performance (now including CWV) of your pages over time, providing a prioritized list of guides on how to improve. It’s essentially an alternative to PSI and is powered by PageSpeed Insights. All tests are run using a simulated mobile device, throttled to a fast 3G network & 4x CPU slowdown.
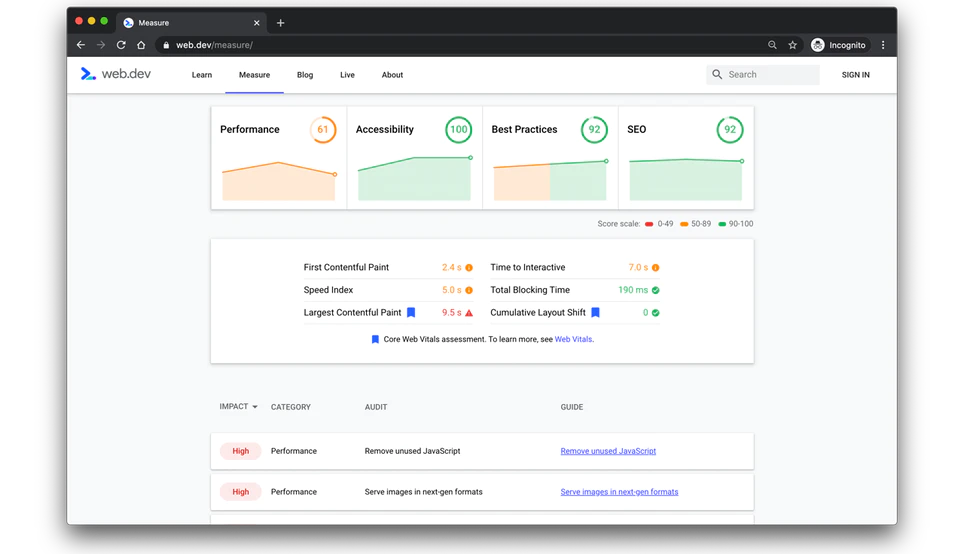
Its interface is somewhat easier to navigate and you get tips to improve your user experience, performance, SEO, and accessibility.
Google Search Console
We’ve already talked about the use of GSC for CWV. It provides field data for both desktop and mobile for all your verified website properties. In the “Enhancements” section, open the Core Web Vitals report to get a detailed view of your CWV performance for the device type you select.
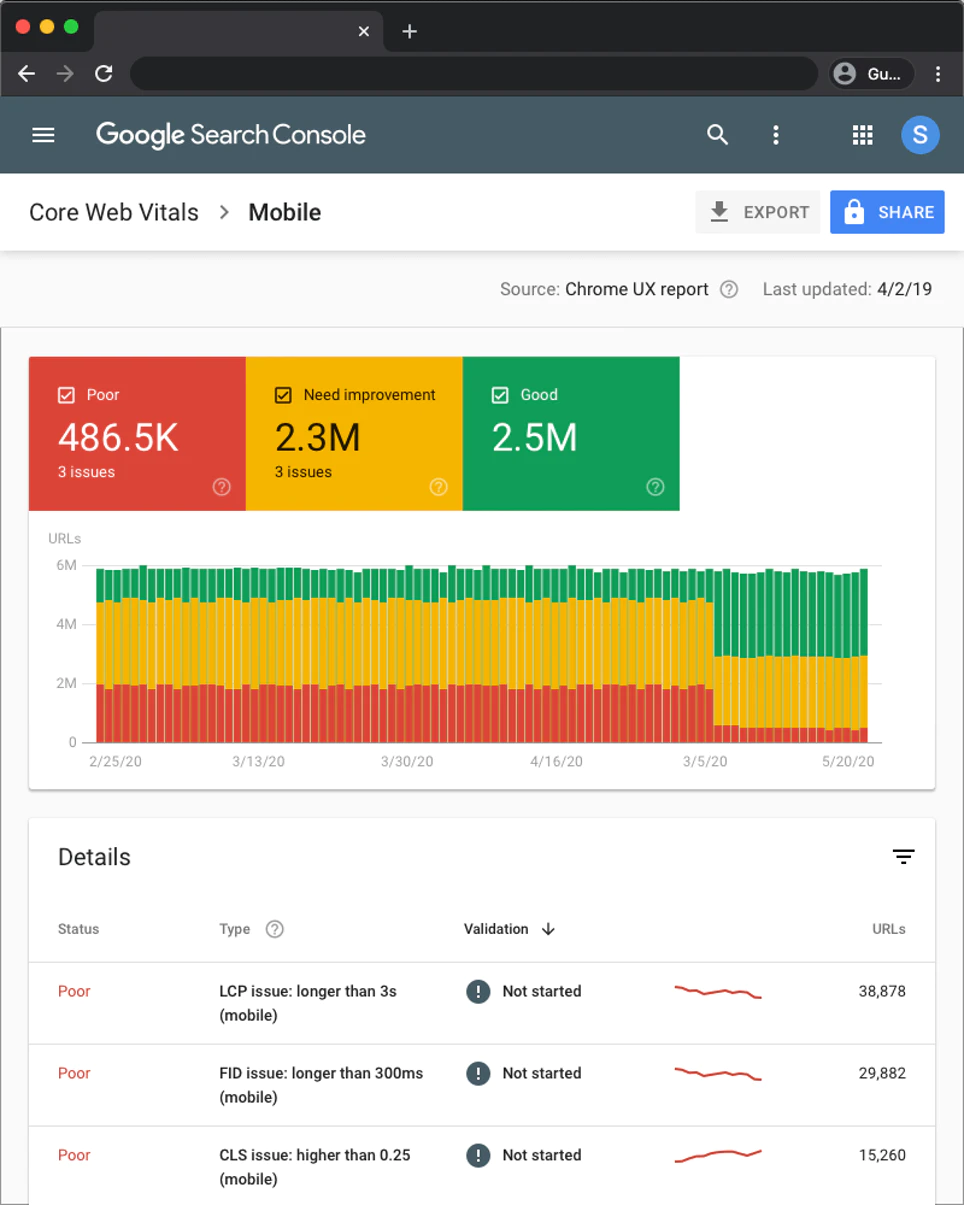
URL performance is grouped by status, metric type, and URL group (groups of similar web pages). It makes sense for Google to group URLs that have the same issues holding back page load performance.
The report is based on the three CWV metrics and if a URL does not have a minimum amount of reporting data for these metrics, it’s excluded from the report. Once you identify a URL group that has CWV-related issues, head over to PSI to learn about specific optimization suggestions for representative pages.
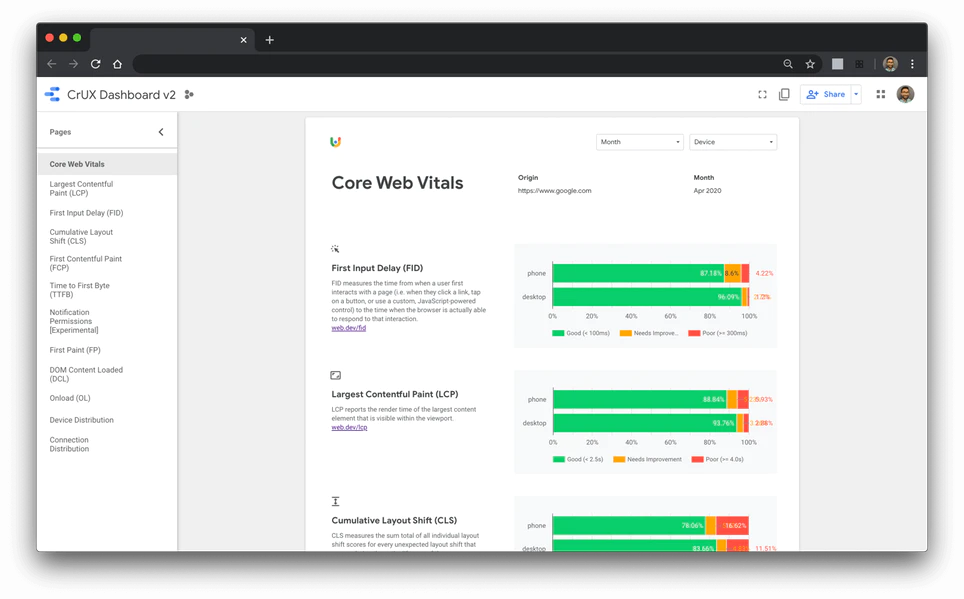
Besides these five tools, it’s also a good idea to use the revamped Chrome UX Report (CrUX) dashboard to monitor the distributions of all of the Core Web Vitals metrics. Learn how to do that here.
Moreover, you can also use the official Web Vitals extension for (desktop) Google Chrome.
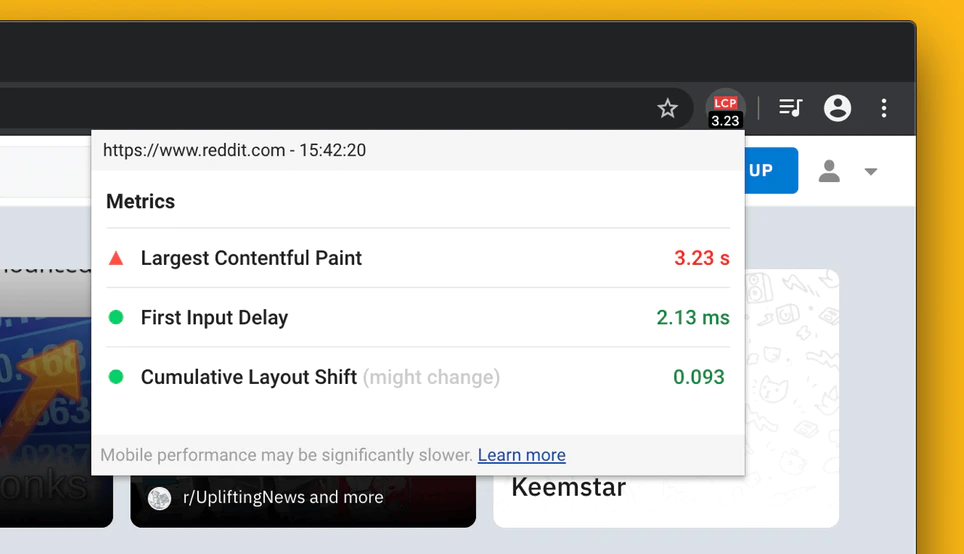
This extension is useful in catching issues early on during your development workflow and as a diagnostic tool to evaluate the performance of CWV as you browse the web.
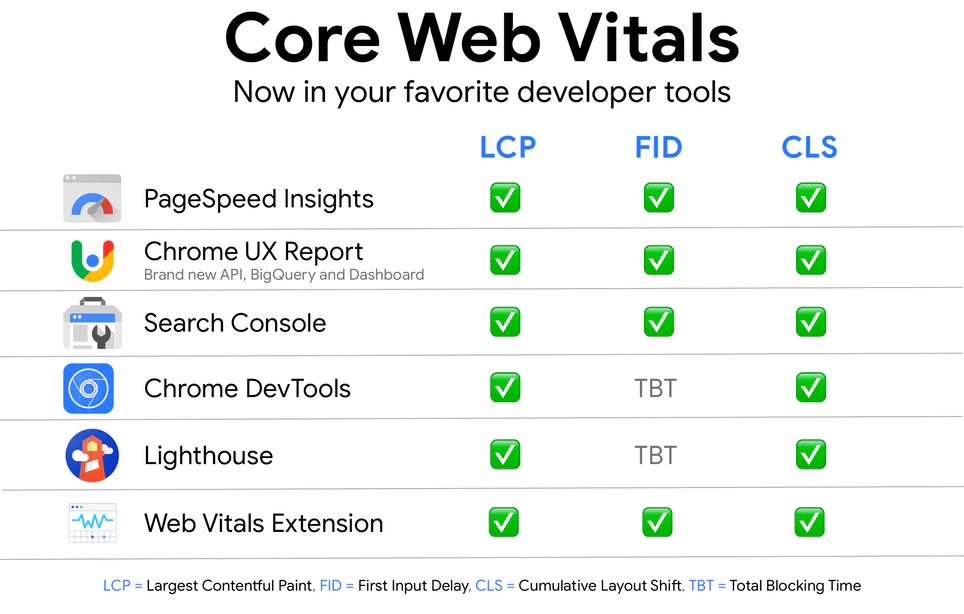
Core Web Vitals are now readily available in all Google Developer tools.
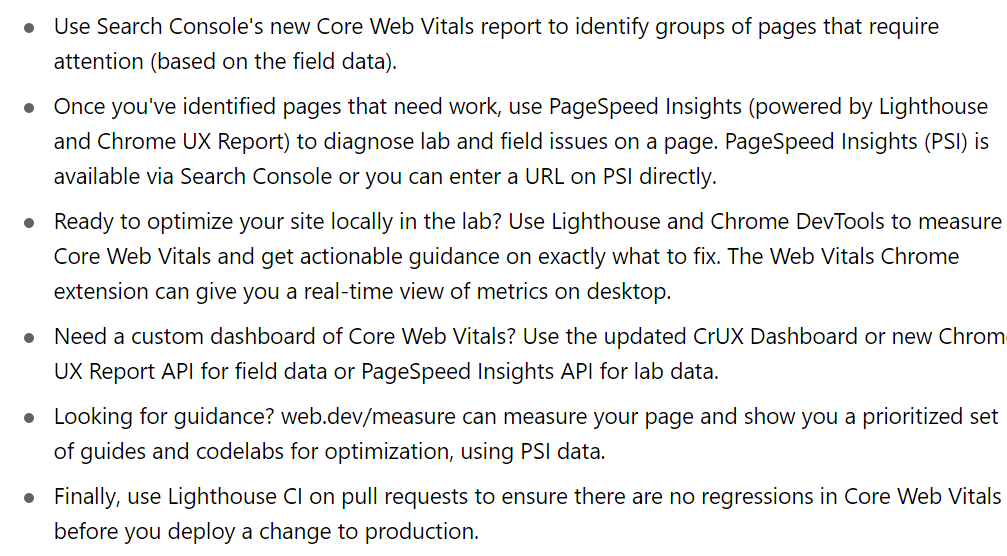
And to begin your journey optimizing UX with Core Web Vitals, Google recommends the following workflow:
So what tools are the experts using for CWV analysis?
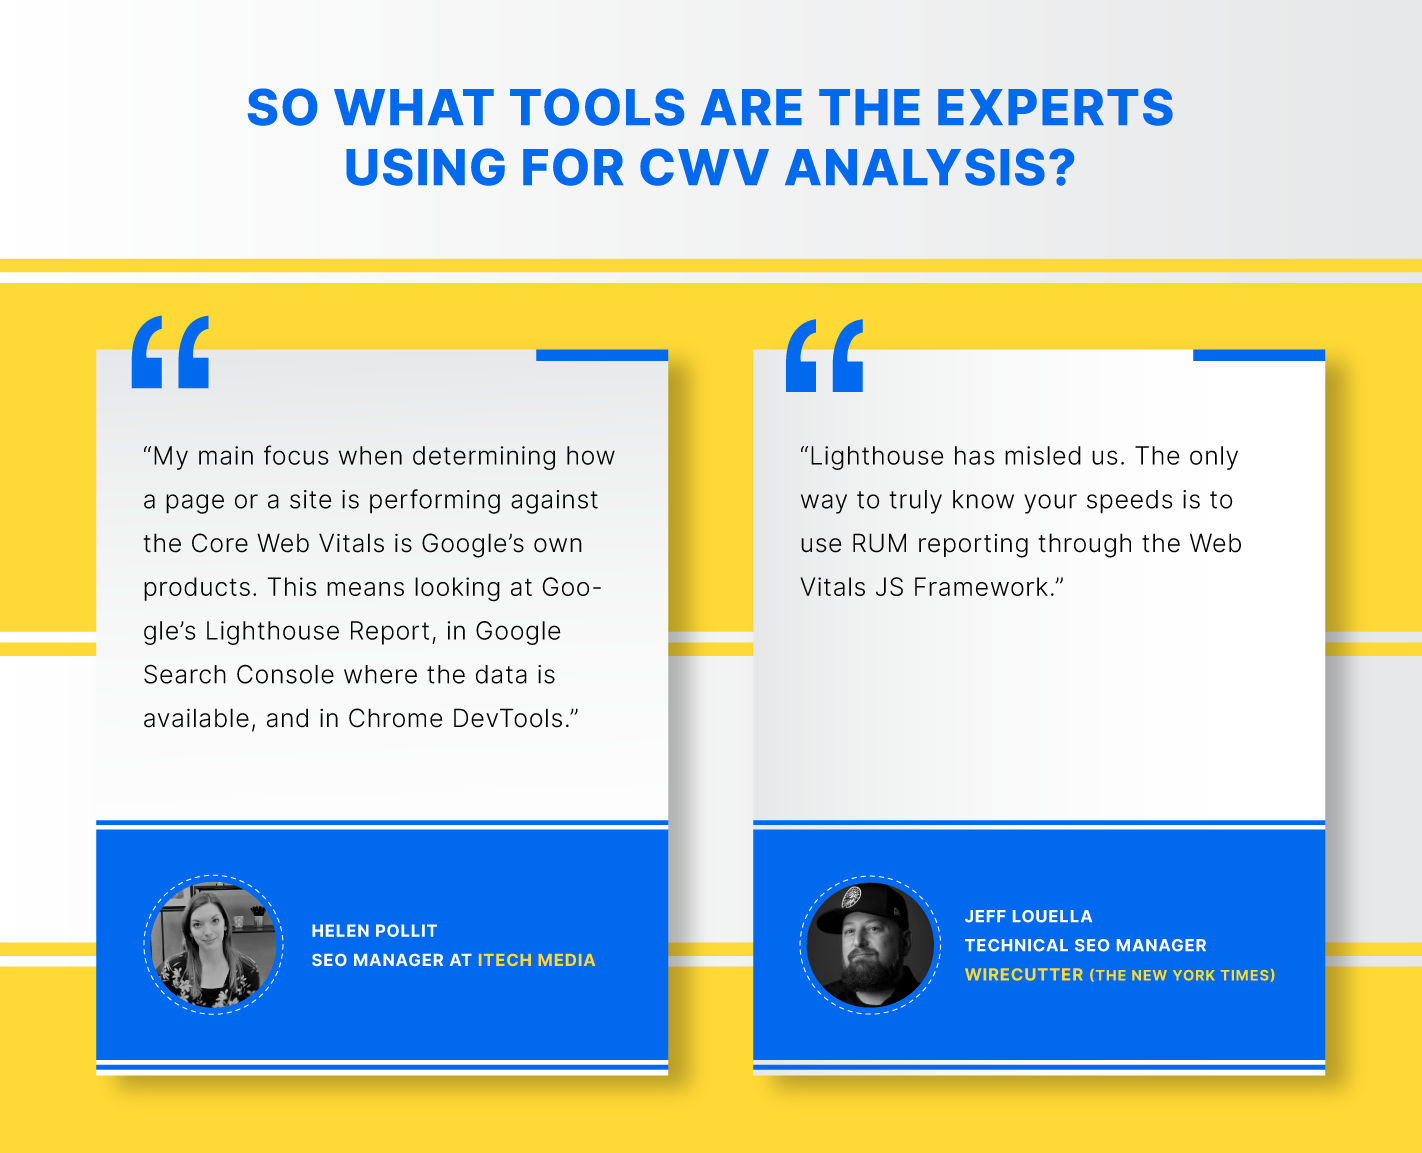
“My main focus when determining how a page or a site is performing against the Core Web Vitals is Google’s own products. This means looking at Google’s Lighthouse Report, in Google Search Console where the data is available, and in Chrome DevTools. Google has provided a lot of resources around measuring Core Web Vitals, it makes sense to me to use them,” says Helen Pollit, SEO Manager at iTech Media.
“Google’s own tools like Search Console aggregate field data over 28 days so seeing an immediate impact of any changes we make is hard. That’s why at iTech we’re using other tools like webpagetest.org to monitor the effects of our development work over the course of a couple of weeks from their deployment. First Input Delay (FID) is not measurable outside of field data so we’re monitoring Total Blocking Time which closely correlates to FID for a more immediate indication of whether FID is likely to have improved following any changes made,” she explains.
“I think the area where SEOs need to be a bit cautious when it comes to optimising for core web vitals is that the metrics themselves can be inconsistent when auditing a page within PageSpeed Insights or Lighthouse. Sometimes websites will need to sacrifice a tiny bit of performance to make their sites look great. If you don’t have a developer, focus on optimising what you can control e.g. images. That way, you won’t spend so much time and resources trying to reach a 100 score,” suggests Itamar Blauer, SEO Consultant
However, Jeff Louella, Technical SEO Manager at Wirecutter (The New York Times) says “Lighthouse has misled us. The only way to truly know your speeds is to use RUM reporting through the Web Vitals JS Framework.”
So your best bet is to look at a number of different tools (such as the ones outlined above) and collating findings to get prescriptive insights that you can implement step-by-step.
What experts recommend their clients regarding CWV
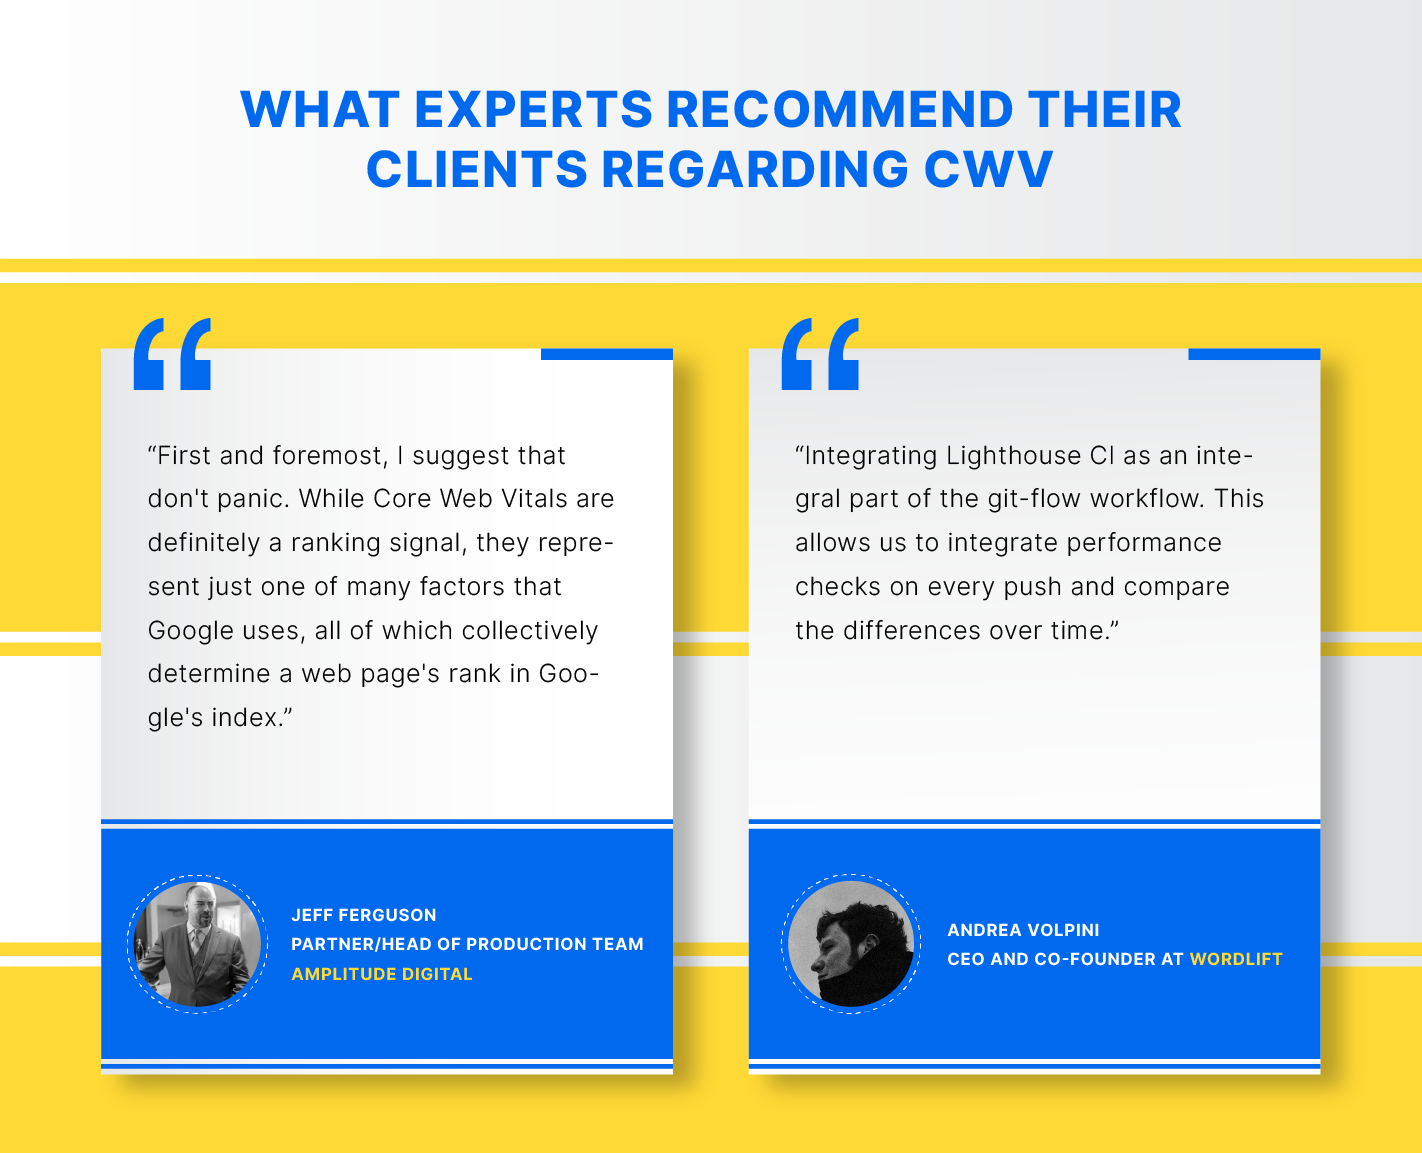
We asked technical SEO experts and leaders as to what they suggest to their clients about Core Web Vitals.
“First and foremost, I suggest that they don’t panic. While Core Web Vitals are definitely a ranking signal, they represent just one of many factors that Google uses, all of which collectively determine a web page’s rank in Google’s index,” answers Jeff Ferguson, Partner/Head of Production Team, Amplitude Digital.
“I also make a point of letting them know that, like many of Google’s ranking signals, optimizing for Core Web Vitals will benefit their website across all channels, not just organic search. Ensuring that your web pages load and can be interactive quickly and don’t shift around while users are trying to read content should be a goal, even if Google didn’t use these metrics for ranking. Highlighting this last point can often allow marketers to gain priority in the web development team’s ever-growing to-do list compared to calling it out as an ‘SEO thing,’” elaborates Ferguson.
Andrea Volpini, CEO and Co-founder at WordLift tackles this new update for their website and their main clients by “integrating Lighthouse CI as an integral part of the git-flow workflow. This allows us to integrate performance checks on every push and compare the differences over time.”

“Really does depend on the circumstances – the client, the platform, the market, and the competition. Speeding up a site will only do it good but the budget may well be better spent elsewhere,” says Simon Cox, Technical SEO Consultant, Cox & Co Creative.
“We’ve had a good amount of warning for Google rolling this out, which is rare, so with clients I’ve been working on, and recommending, two streams of work; the first being identifying and resolving the immediate CLS, FID, and LCP issues, and the second working with development teams on building CWV considerations into future development work,” answers Dan Taylor, Head of Research & Development at SALT.agency, and Editor at RussianSearchNews.com.
“It’s also been important to establish the narrative and mindset that these aren’t fix ‘em and they’re done metrics, as competitors develop solutions to their own issues and the general ‘internet’ advances, user expectations will change and the benchmarks will move forward. Fortunately, there are scalable ways of monitoring this, and the ongoing impact,” explains Taylor.
“How often this will update is up for debate, with John Mueller confirming via a Webmaster Hangout back in April ‘21 that it wasn’t decided yet how frequently the benchmarks shall move,” he adds.
So it all ties to our overarching theme of optimizing for user experience and not sweating about CWV as a ranking signal. Yes, CWV does have an impact on your SEO, as do hundreds of other ranking factors and signals. But even if Google hadn’t yet counted them as official ranking signals, it would make a lot of sense to start investing in optimizing your website for these user-centric metrics.
The future of Core Web Vitals
One thing’s for certain — Google will continue to refine Core Web Vitals in the coming years.
As of now, here’s what you can expect:
- Google may make FCP a Core Web Vital in the future, or at the very least, increase its significance.
- Google has already changed the metrics used to measure speed in their tools in the past few years, along with their thresholds for what is considered fast or not. The same is likely to happen with CWV.
- For LCP, <svg> and <video> may be added in the future.
- CLS continues to measure even after the initial page load. Google is soliciting feedback on this metric, and you can expect some changes in the coming months. Its importance may also increase.
- Google’s trying to add metrics that measure animation performance.
- “Good” FID could become stricter — from under 100 ms to 50-75ms.
- Google’s trying to better measure Web Vitals in Single Page Applications (SPAs).
So, what are the most common myths and misconceptions regarding CWV? We consulted experts and found a common theme:
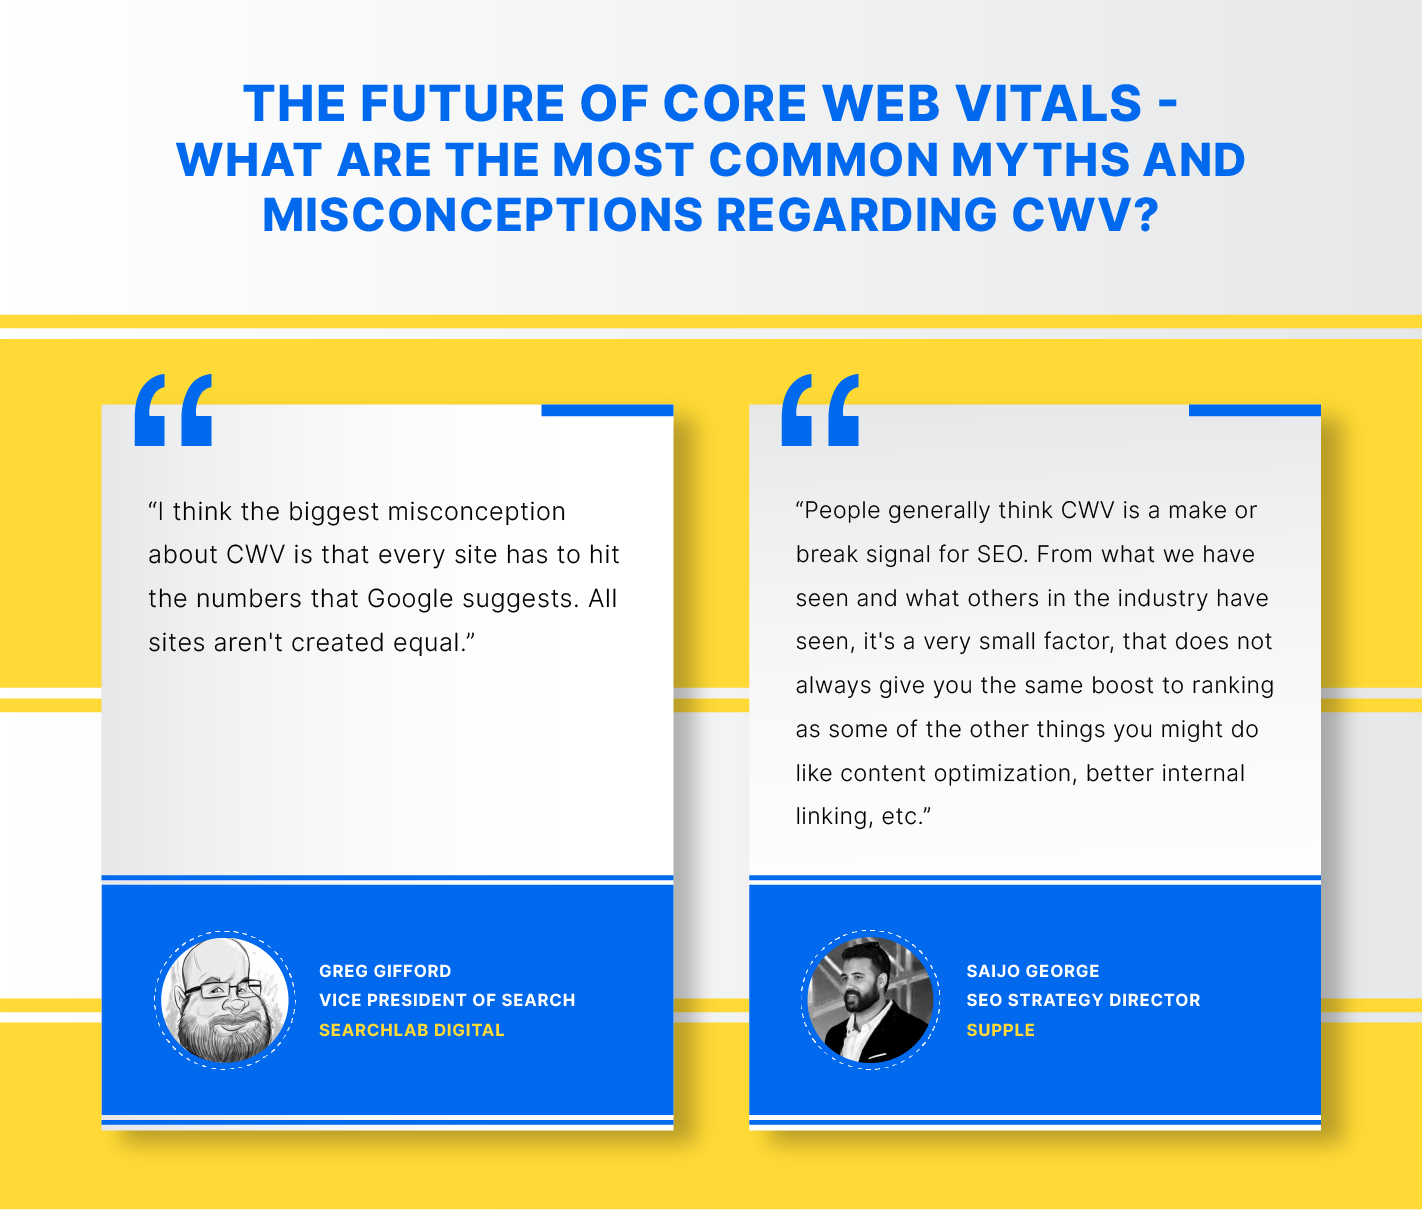
“I think the biggest misconception about CWV is that every site has to hit the numbers that Google suggests. All sites aren’t created equal. A simple eCommerce site has different requirements than a website for a car dealer, who has different needs than an attorney. For example, car dealerships are much more image-heavy, so they’ll likely load a bit slower – but that doesn’t mean they’re going to stop showing up in searches,” says Greg Gifford, Vice President of Search, SearchLab Digital.
“People generally think CWV is a make or break signal for SEO. From what we have seen and what others in the industry have seen, it’s a very small factor, that does not always give you the same boost to ranking as some of the other things you might do like content optimization, better internal linking, etc.,” suggests Saijo George, SEO Strategy Director, Supple.
“People also assume the score seen on PSI is a concrete CWV score. Most non SEOs don’t realize that ranking for CWV is based on field metrics or Real User Metrics (RUM) from Chrome User Experience Report (CrUX). So if you run PSI and look at the Lab result or run Lighthouse on a high-powered computer and get good scores, that may not be reflective of what people see in the real world,” he explains.
“Some things with CWV are not in your control, for eg: if a big portion of your customers uses a browser extension that has a negative impact on CWV or if you get a large portion of your traffic from countries where internet connections are slow then those things will impact your Real User Metrics score for CWV,” adds George.
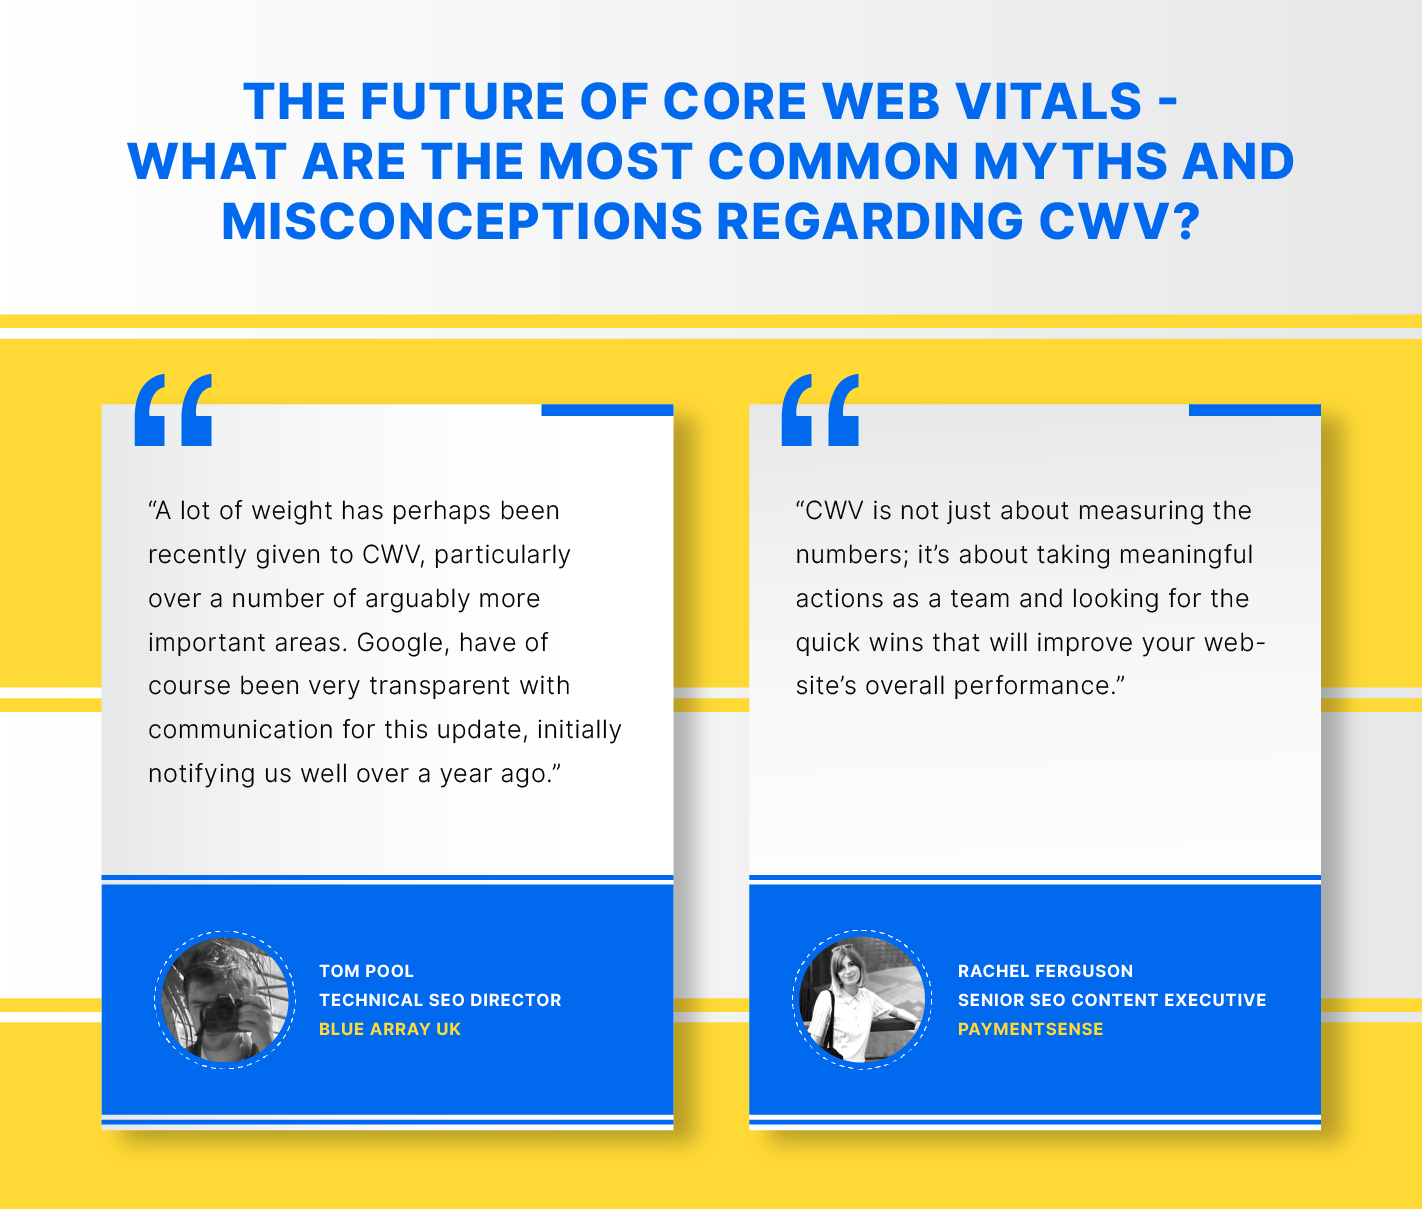
Tom Pool, Technical SEO Director, Blue Array UK thinks that “a lot of weight has perhaps been recently given to CWV, particularly over a number of arguably more important areas. Google, have of course been very transparent with communication for this update, initially notifying us well over a year ago.”
“One key thing to bear in mind, that while all sites should be easily accessible and usable, if you’re performing poorly, and your competitors are too, it’s not as important from a ranking perspective to ensure all CWV are seen as ‘Good’. However, if your competitors are being seen as a lot better than you in regards to CWV, it’s a more important conversation to be had, and effort should be made to resolve issues that are seen,” he elaborates.
And Rachel Ferguson, Senior SEO Content Executive, Paymentsense thinks “page speed is an interesting one when it comes to CWV. People can get hung up on their Lighthouse score without looking at the bigger picture – I.e. the LCP. You can have a fast page speed, but if your above-the-fold content fails to load quickly, users will be left confused. They’ll think the page has a much slower loading time than it actually has, which will impact their experience.”
“CWV is not just about measuring the numbers; it’s about taking meaningful actions as a team and looking for the quick wins that will improve your website’s overall performance. Whether that’s educating your design team about image compression or working with your devs to clean up unused CSS, we’ve all got a part to play,” she explains.
The bottom line? While CWV is certainly an important ranking signal, there are plenty of other areas like content, links, etc. that’ll drive better returns for your efforts. So focus on them first. That being said, CWV will slowly gain more importance, so it’s a good idea to start optimizing your website for them sooner rather than later.
Wrapping up
Ultimately, Core Web Vitals may just be a starting point for an even stronger focus on user experience from Google.
It’s clear how Google is becoming increasingly obsessed with user experience, and so should you. After all, who doesn’t love a website that provides a stellar UX? It’s how you get users to engage and revisit.
And Web Vitals are metrics created to measure and improve your site’s UX.
Of course, high-quality and relevant content should always be your first priority — and while these metrics have a small SEO impact as of mid-2021 — you can expect CWV to become a more prominent ranking signal in the not-so-distant future. They’re already vital to your site’s UX. So consider putting the above tactics and expert advice into practice as soon as you can.


