How to analyze data from a Google Discover report to find growth points
We recently added a new report to the “Google Search Console” section, and all our customers were able to analyze data from Google Discover. Read more about the update in the article: Product Update. GSC Discover: dive deep into search results analysis.
Now we will tell you about analyzing data from Google Discover and how to use this data to drive traffic.
What is Google Discover
Google Discover is Google’s personalized recommendations for users. This service was launched by Google in 2018, and for many websites Google Discover is a significant source of traffic.
What can be shown to users in Google Discover? Only those articles, reviews, news and pages that correspond to the user’s interests. For example, the user is constantly looking for news about Google Search updates, so it is most likely that the user will find Google’s blog in the recommendations feed. These recommendations are formed by artificial intelligence based on the personal data of the user’s searches, content and video views, as well as on the basis of local preferences.
But Google Discover and Google News are not the same. Google News is another separate Google service, created specifically for finding the latest news in your area and around the world.
And Google Discover can show very different content, even the one that was created a long time ago, if it meets 100% of the user’s interests.
As you can see, Google Discover is quite an interesting source of additional traffic for many resources. If you have informational content, product reviews, or even video pages, etc., then you have a chance to get traffic from Google Discover.
How to get traffic from Google Discover
There are no official instructions from Google regarding content. However, it is known for sure that the content must be in the allowed topic. Also, the site should definitely be optimized for mobile devices (Google Discover is primarily a recommendation feed for mobile device users). Content should be unique and optimized. It is logical to assume that, in addition to uniqueness, the content should be fascinating, authoritative and interesting. Among the requirements, there is nothing that does not apply to good SEO.
But all experts recommend paying attention to search trends. If a topic is super popular right now, you should create a high quality article about this trend. Or you can update an old article on the site: this method also works very well.
So, to get traffic from Google Discovery, you need to optimize your site for mobile devices, create high quality content and make it crawlable and accessible to search robots.
By the way, promotional offers can also be shown in Google Discover. Therefore, it can also become an additional source of traffic for e-commerce sites.
How to analyze data from Google Discover
You can analyze data from Google Discover using JetOctopus. To do this, you need to connect JetOctopus to the Google Search Console. JetOctopus will automatically pull data and generate reports.
To begin, select the time period for which you want to see data. You can also choose a country: by analyzing the performance of pages in different countries, you can get a lot of insights about what to do to display your content in a certain country.

Next, you will see how many unique pages were shown in Google Discover (Pages In Discover) and how many pages were visible for more than 2 days (Visible 2 or More Days). Standard Google Search Console reports do not display this data.

- If you have a lot of unique URLs in your Google Discover feed, this indicates that your site is well optimized for recommendations.
- If, in your opinion, the pages of your site should be in Google Discover, but they are not, think about the technical optimization of the website.
- If you have a lot of pages that have been showing for more than two days, that’s great! This means that your content is popular and of high quality.
Click on the “View Pages” button to go to the page table. Here you can adjust the number of active days and determine which pages have been shown in Google Discover for the longest time.

Explore these pages and analyze what makes them special. Perhaps they are very fast, or the content has a good visual design? Such an analysis will help create a hypothesis for the test.
On the Pages Per Month graph, you can see the dynamics of the appearance of pages in Google Discover. Pay attention to how the situation changed depending on the season and depending on the most popular topics in society.
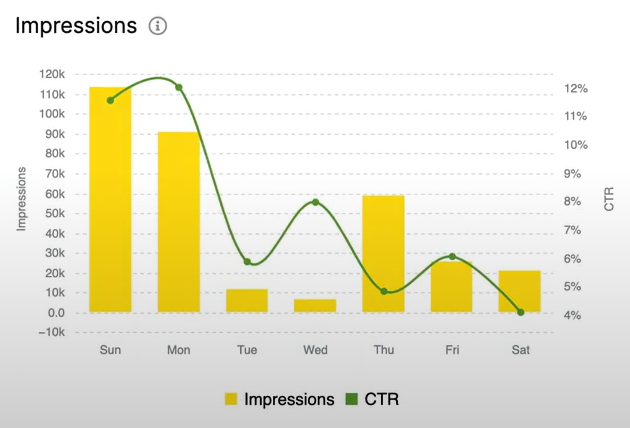
The Pages Count Per Day chart is somewhat similar, but it shows how many pages were viewed on a given day of the week.

What can we learn from this chart? As we know, the activity of people on the Internet depends on the day of the week. Also, you can easily determine on which days of the week people are most interested in your site, which topics are more popular on different days. Consider this when planning your content strategy.
And of course, clicks and impressions. A click is how many people came to your page from Google Discover. Impressions are how many times your page was shown in Google Discover. The higher the click-to-impression ratio, the more effective your content is.

What else to pay attention to when analyzing Google Discover data
Also analyze the following:
- what types of pages are most often in the Google Discover feed (blog articles, promotions or reviews?);
- what is the effectiveness of each type of page;
- what pages have many impressions but few impressions;
- how long are your pages in the feed on average;
- what are the technical characteristics of the pages that are displayed in Google Discover.
Surely, you can use segments.
Answer all these questions to improve the page and get additional traffic from Google Discover.
You may also be interested in data analysis from Google Search Console:


