How to find out the frequency of scanning by search robots
Regular scanning of the website by search robots ensures the updating of data in the index. The regularly crawled pages will also have an up-to-date snippet in the SERP. However, sometimes crawling is excessive and can cause server overload.
If your website is popular and constantly updated, extreme crawling by search engines can even lead to a lot of 5xx status codes. In this case, users can also receive 5xx if they use the site during peak crawling.
You may be interested in: How Googlebot almost killed an e-commerce website with extreme crawling.
Different search engines have different scanning frequencies. So, it is needed to monitor each search engine in order to identify in time the bot with the highest load on your webserver.
In this article, we will tell you how to monitor the frequency of scanning by search engines.
A step-by-step guide to analysis of scan frequency by search engines
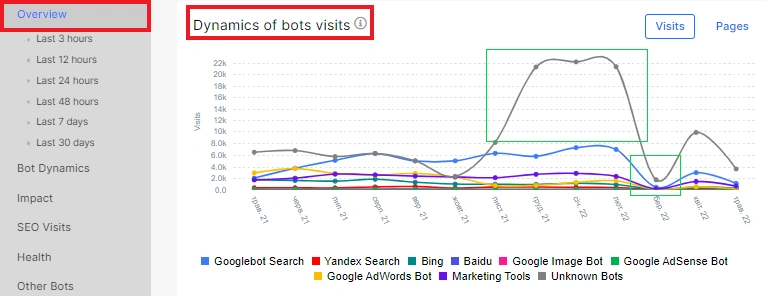
The most important information about the scan frequency can be found in the “Overview” report – “Logs” menu. On the “Dynamics of bots visits” chart, you can see the dynamics of visits by various bots and search engines for the selected period.

In this diagram, you can easily see the extreme crawling. In most cases, the scanning dynamics is displayed in real time. Therefore, you will quickly see if a particular bot has dramatically increased its scanning frequency. You can also set up a scan boost alert.
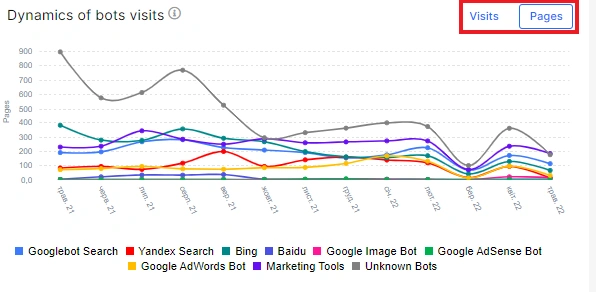
Pay attention to the fact that you can analyze crawled pages or bots visits.

If the number of pages on your website did not change, but the number of visits increased, this is one issue. The problem may be that search robots started scanning URLs with get-parameters, there were changes in the robots.txt file, indexing rules changed, etc.
Another issue is when the number of pages has increased, but the number of visits has not changed. This could mean that crawlers are not finding new pages or the crawling budget is not increasing because crawlers are scanning useless pages.
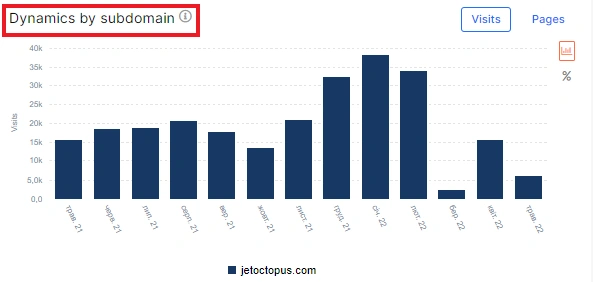
In addition, you can analyze the frequency of search robots crawling by subdomains. In the “Overview” report, there is a separate “Dynamics by subdomain” chart, where we show the ratio of visits by subdomains (in total for all bots).

It may be interesting: How to analyze what types of search robots visit your website.
For an in-depth analysis of the frequency of crawling by different robots, we have created a separate report “Bot dynamics”. Here you can find information about how each type of search engine crawls your website and the crawling budget for the selected search engine.

Select the desired period, bots type and domain.

Also, you can choose a segment of pages.

More information: How to use segments.
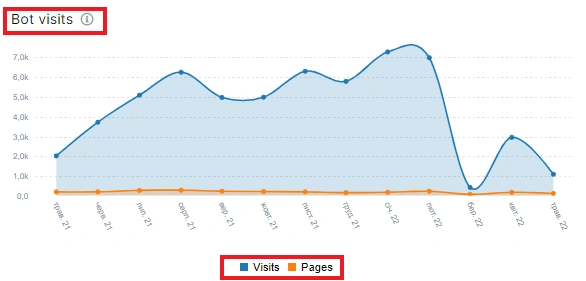
In the “Bot visits” chart you can find a comparison of the crawl rate (number of visits) and the number of visited pages.

Clicking on the chart will take you to the data table with a list of all visits.
What to pay attention to when analyzing the frequency of scanning
When analyzing scan frequency, keep the following cases in focus:
- the ratio of visited pages and the number of visits;
- the frequency of scanning of each robot (the frequency of scanning by mobile and desktop GoogleBot may differ fundamentally);
- whether the number of non-200 response codes, in particular 5xx or 4xx, increased during scanning peaks;
- check whether the website was available for users during the peak search bots load;
- how clicks and impressions changed after a high crawl period: if the search engine crawled useful pages, clicks and impressions should increase;
- which pages were scanned by the search robot – if there are noindexable pages or there are only useless ones in the list of scanned pages, you should think about limiting the scanning of certain pages; the easiest way to limit the scanning of useless pages is to block them by robots.txt file;
- crawling efficiency of each search engine: if a certain search engine is extremely crawling your website, but you are not getting conversions from that search engine, consider limiting the crawling of your website by that search engine.


