Logs files register each request the web server receives. If you want to get SEO insights from logs, you’ll need to deal with heavy-data processing. That can only be done by an enterprise-grade logs analyzer. Jetoctopus precisely shows how any bot is crawling your pages, so you can optimize your site to increase organic visibility. Sounds great, right? Wait till we’ll show you how to get the most out of the log analyzer on the example of a real website.
Overview
Segment & compare visits for any period
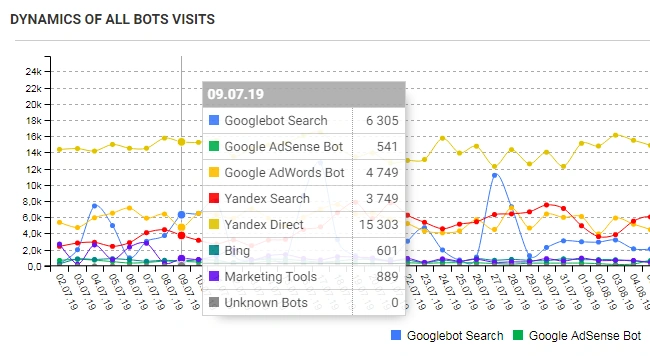
One of the main questions within bot behavior at websites is the quick visiting of indexable pages. That’s easy – you click on an indexable segment of your website, choose the period, and estimate the frequency of all bots/concrete bot visits:
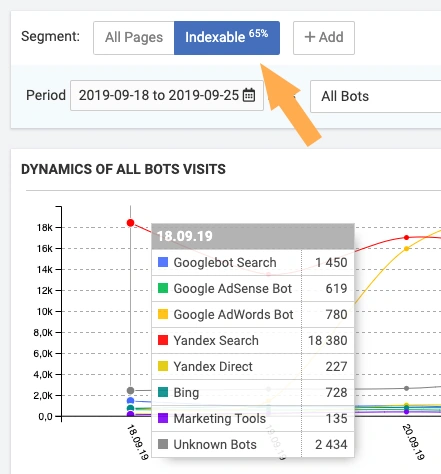
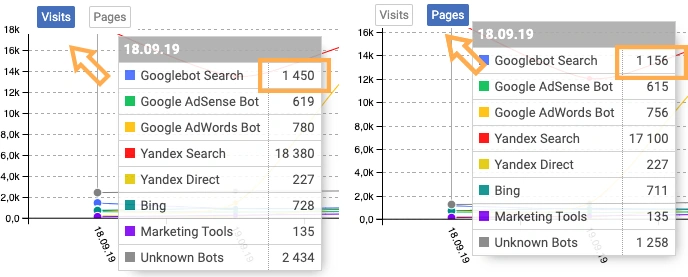
You can choose any period for analysis and then group data by day/week/month. You can track either how many times bot was on your website (Visits) or how many pages it crawled (Pages):
Dynamics of SEO visits
After you saw how bots crawl your website, analyze users organic visits on indexable pages:
On this website there is a dramatic decrease in users` visits from Google search. Traffic drops are never fun and, if left unaddressed, they can be extremely damaging to your business. However, with a data-driven approach to uncovering the reasons behind a drop, you can survive any drop in traffic.
Dynamic of fake bots:
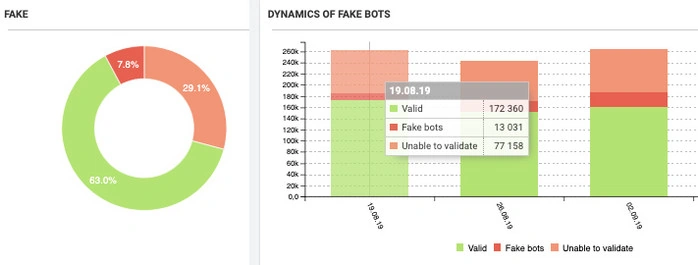
Congrats if fake bots crawl your website intensively, it means you are in the TOP of business niche. The bad thing is that these bots can overload your website, so think about blocking IP addresses of these nasty visitors.
Bot Dynamics
How each bot perceives your website
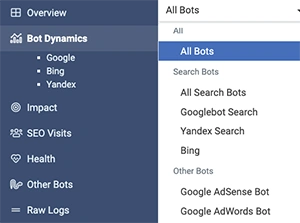
After checking how all bots crawl pages in general, let’s dive deeper into the analysis of concrete bots in the Operative section. Jetoctopus processes more than 40 different bot types – Google Search, AdWords, Yandex, Bing, and even marketing tools like SemRush, Ahrefs, etc. Let’s pick up Googlebot to analyze how long it waits for the pages, what responses it gets, what extensions it sees:
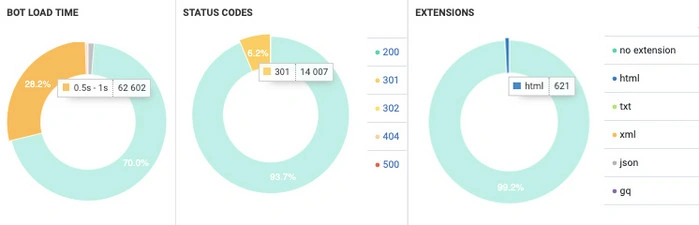
All charts are clickable – in 1 second you get to the datatable with the list of slow/broken pages.
How to get ready for the mobile-first index
Particular attention should be paid to the correlation between desktop/mobile bots visits:
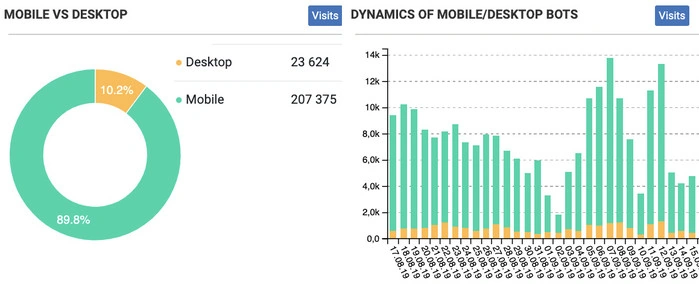
If you perform log file analysis on a regular basis, you can detect a shift to the mobile-first index by looking at the specific bot user agent. Sites that haven’t been switched over to mobile-first indexing will be crawled primarily by Googlebot Desktop, while sites that have switched over will see the primary user agent as Googlebot Smartphone.
Impact
Overlapped data from logs with crawl report
You’d better sit before looking at the Pages visited by bot chart. You may think you know your website but there are pages you don’t even know about. Let me illustrate what I’m talking about:
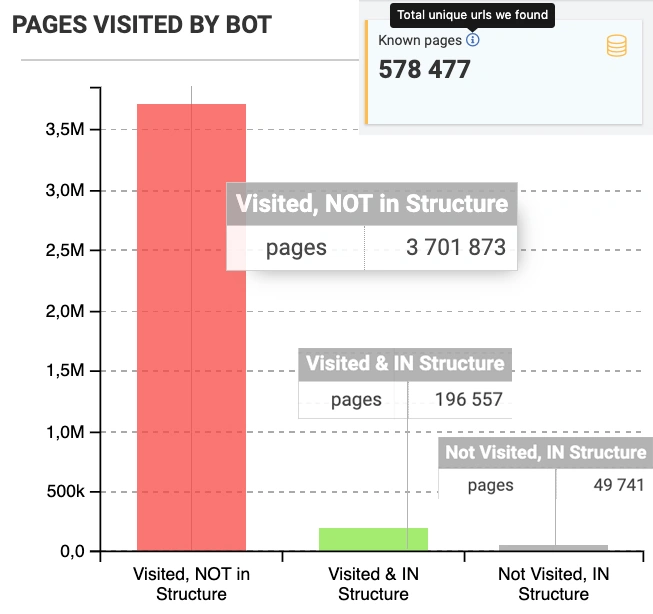
Crawler found 580K indexable pages on the website but only 197K pages are in the website structure and frequently crawled by bot. There are 3,7M (!) orphaned pages that aren’t reachable through links but are visited by bot. Crawl budget is wasted there. This is a wide-spread issue on a big website with a history of redesigns and migrations. Check whether you have the same mismatch on your website.
Correlation between visits and pages
Jetoctopus applies the Pareto principle to find out how many pages on your website provide 80% of bot’s visits:
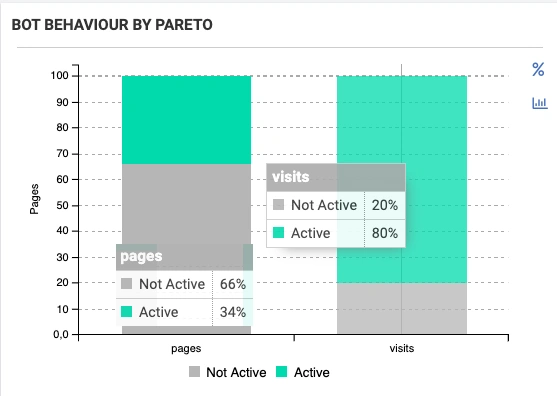
Here we see that 34% of the pages are ‘active’. They bring 80% of bot’s visits. Since these pages are the most profitable, find out which technical parameters make these pages ‘active’, and then replicate the best practices on the whole website.
How often bot visits the page
It’s useful to know which pages are the most frequently visited and thus require your special attention:
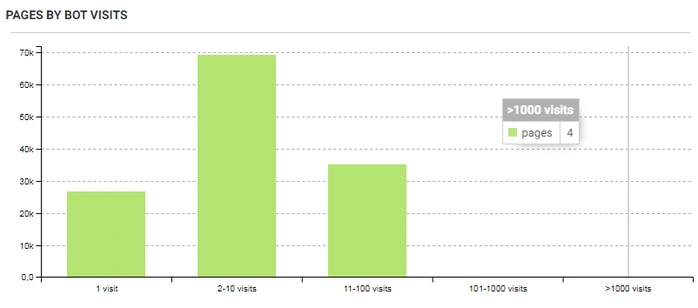
In the last month, only 4 pages got more than 1K visits on this website, and the task is to explore content, links, tags there to understand why these pages are so popular. When you find the answer, you can replicate the best practices on the whole website and thus increase bots visits to all commercial pages.
How technical parameters influence bot visits
Let’s, for instance, check the correlation between the number of internal links and bots visits:
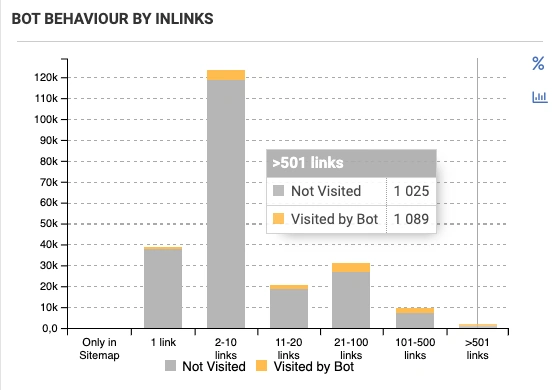
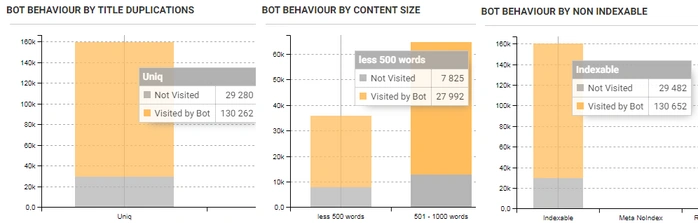
The chart proves the importance of a well-considered internal linking structure on big websites. The more links are on the webpage, the more it is important for a bot. You can also track how the number of words in content, presence of duplications and non-index directives, number of clicks from the main page (DFI), and other tech parameters influence the crawl budget:
SEO visits
The next revealing chart is the analysis of pages with organic traffic:
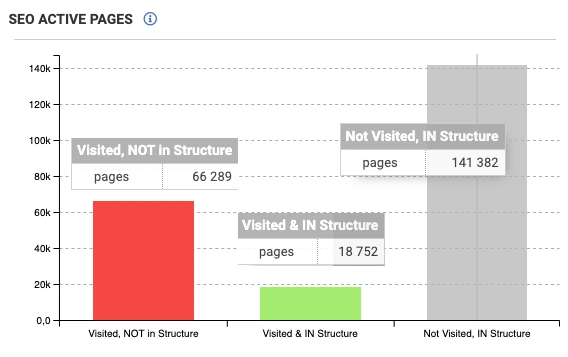
During the last month, people visit pages 85K times but 66K of these visits were on orphaned pages. In addition, 141K pages are ignored by visitors. Now you can click on the column and compare technical parameters on visited pages with ignored pages to find the reason why this happens.
Health
Here we gather the crucial issues on your site that were found in logs.
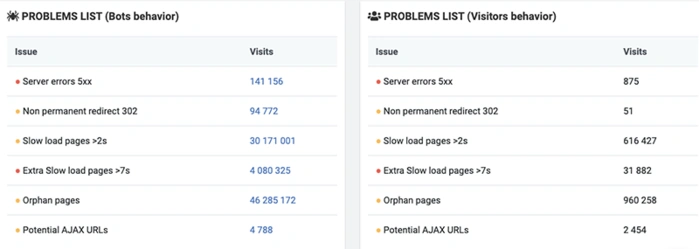
All data is clickable – just click on a concrete problem and you get to the datatable to the list of problematic URLs.
Raw logs – real-time stream of each visit on your website:
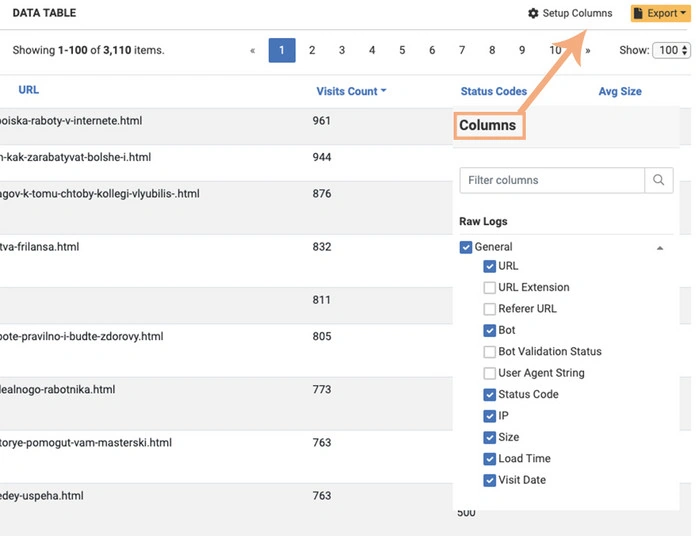
You can include/exclude the data in the Setup Columns section. All data is stored in the cloud, but if you want to save the ‘print’ of a table in the current state, you can export it in Excel or CSV formats.
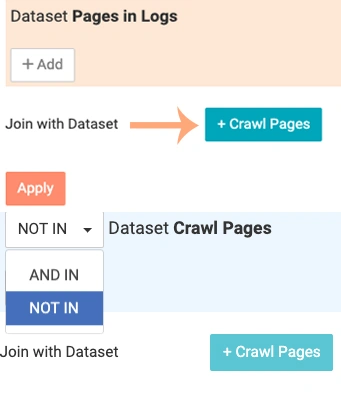
Pages in logs – concrete URLs that bring you traffic
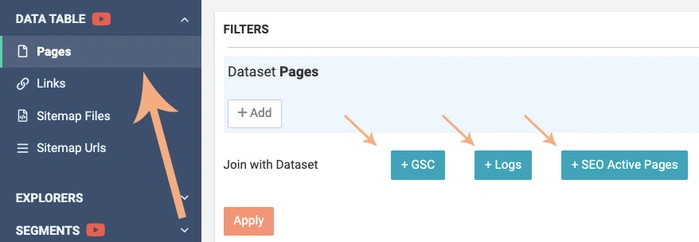
Here you get a list of pages that were visited by the bot at least once during the chosen period. The great feature is that you can join the data from the crawl report. You open Pages in the logs section, click on +Crawl Pages button and сlick Apply:
In the same way you can analyse how many pages get organic traffic (+SEO Active pages) and what is CTR of each page (Google Search Console)
Logs – a treasure trove of data
At first glance, these similar text lines in the root of your website look boring. That’s right. But Jetoctopus has team figured out a way to combine your logs with crawling and GSC data to give you visualized insights of bots, users behavior. Without delays. Without log lines limits. Without wasting your time and efforts. Without further ado, test Jetoctopus log-analyzer. Here is the insightful video tutorial. Feel free to comment or tweet your questions to @Jetoctopus.
Get more useful info How to compare crawls