We are so excited by this update because it totally changes the way of interacting with GSC data. We used to watch the trends of Impressions, Clicks, CTR, Positions, etc. It gave us a general understanding of the situation in SERP but it didn’t give us any details. But this is not the case anymore! Now you will know exactly which group of URLs experienced a massive growth and which ones experienced a massive drop (impressions, CTR, clicks, active pages, etc.) You should then get the exact list of these URLs. Let’s look at the main features a little bit closer:
Full data from Google, not limited
As you may already know, the Google Search Console allows you to analyze just a sample of 1000 URLs which is purely nothing for more or less a big website.
JetOctopus is now capable of downloading GSC data for up to 16 months and will keep storing and accumulating data for as long as you are using JetOctopus. During the free trial, JetOctopus can be able to download the 3-month period. When you buy a subscription, JetOctopus can be able to download the 12-month period. And if you integrate logs, you will have the advantage of getting GSC data for up to 16 months.
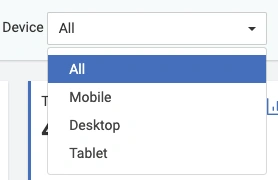
You can analyze your data by desktop, mobile, and tablet as well as the total summary of the data from these devices.
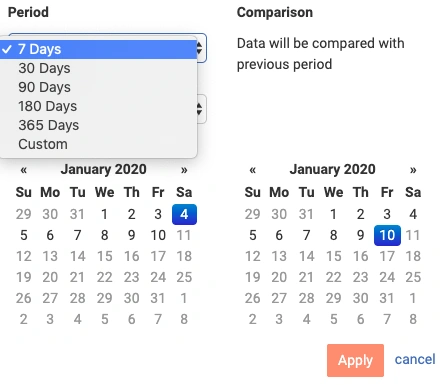
All the data in dynamics
If you want to keep your eyes open for the latest SEO, you should start analyzing all critical criteria in dynamics with more depth. Having ready access to sampled data can give you an understanding of what could be happening currently but it won’t give you information on why and what exactly has increased or dropped. You should always try to get the full data for the comprehensive technical audit. Partial analysis of only your TOP keywords/pages could be harmful for your site
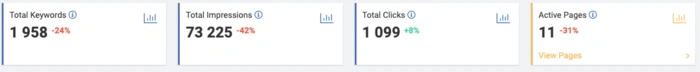
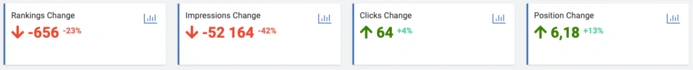
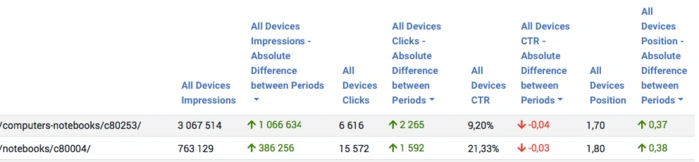
Pick up the necessary information from the current period and then compare it with the previous one. Know the exact percentage change (impressions, clicks, CTR, active pages, rankings).
Dynamics report
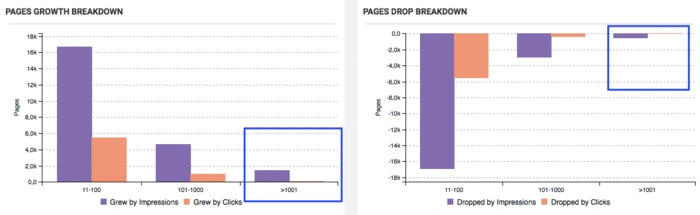
But knowing just the % of change is still not enough. In Dynamics section, we decompose all the changes in groups:
- Pages with growth/drop by Impressions
- Pages with growth/drop by Clicks
- Pages with growth/drop by CTR
- Pages with growth/drop by Position
As always, all data is clickable. You should be just one click away from the exact list of URLs that you can work with.
Pay special attention to dramatic deviations.
Looking at your Winners list of URLs you will know for sure what is working the best at your website and multiply this practice to the rest of your website.
Insights
Here you are getting different insights about your website within SERP efficiency:
- Which positions bring you the most of clicks
- How many rankings you have at 1st, 2nd and further positions
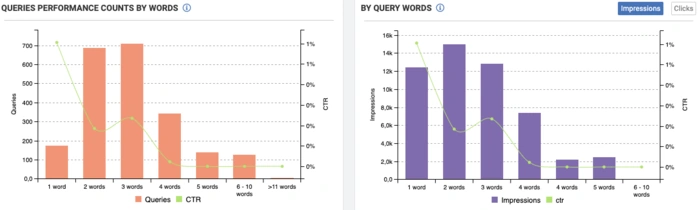
You are able to analyze deeply your queries. How many words do they consist of? And which group of queries in terms of words are the most clickable in your particular case.
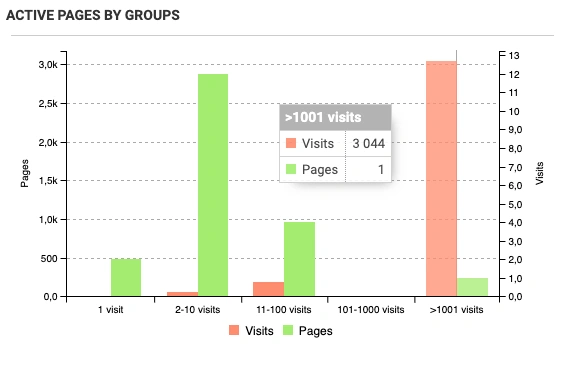
I personally love the “Active Pages by Groups” chart. This chart reveals how many pages bring you the most traffic. In this particular case, you should be able to see that 410 pages bring more than 2.5 million visits. It makes sense to add a segment for these pages and to care for them separately. We should also examine these pages more closely so we can justify the efficiency of these pages and propagate the results to other pages.

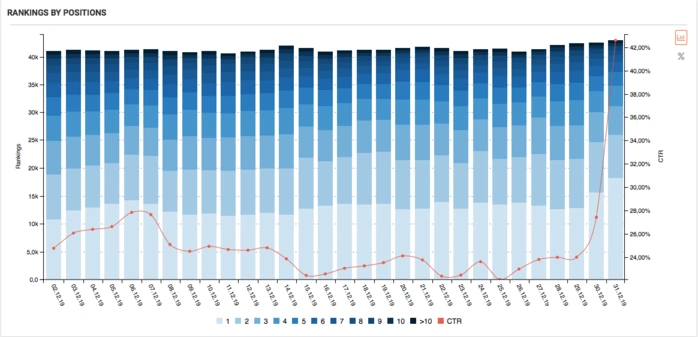
Positions
This graph shows a very absorbing picture of your rankings. The area of the bars that are shaded in dark blue represent the worst-case scenario while the area of the bars that are shaded in light blue represent the best-case scenario.
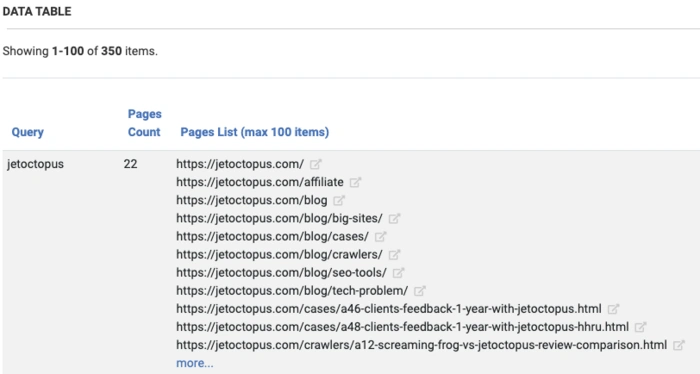
Cannibalization
Cannibalization is a phenomenon that every website goes through. That is, when different URLs of your website compete with one and the same query. This section should help you realize the scale of cannibalization and to resolve the situation for one query with more than 50 rankings.
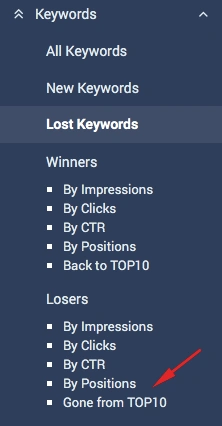
Keywords
Keywords will always keep you updated. They will surely let you know the new words that appear in SERP over a given period, the lost words which disappeared from the SERP. Those words which left TOP 10 of SERP. Your Winners and Losers by different criteria.
Pages
Another vector of analysis–within Pages: New pages, Lost Pages, Winners and Losers by different criteria.
As you can see that this is an absorbing tool for analyzing profound SERP data:
- Full data from Google, unlimited
- All the data in dynamics: pages with growth/drop by impressions
- Pages with growth/drop by clicks
- Pages with growth/drop by CTR
- Pages with growth/drop by position
- Insights section; how many rankings you have at each position such as 1st, 2nd, and so on
- Positions: this chart reflects all the rankings your website gets in SERP.
With this data, you should always be able to know what has dropped and what has increased. You should be able to understand your website much better. And just for 30 euros per month, you can use this spaceship. Integration is as easy as taking one click.
Get more useful info Log analyzer in JetOctopus