
How to analyze JavaScript requests
In this article, we will discuss an important aspect of SEO technical analysis for JavaScript websites: JS request analysis. The processing of your website by search bots depends on the number, volume, and speed of JS requests.
Why is it necessary to analyze JS requests?
Most websites use JavaScript technology, because it allows making websites more convenient and user-friendly. However, at the same time, the use of JS technologies has an impact on SEO and crawling by search engines. First of all, this is due to the fact that client rendering is used for JS websites.
JS resources are JavaScript and other files that need to be loaded for proper page display. You can view a list of all JS resources in Chrome Dev Tools. To access this feature, open Chrome Dev Tools, select the “Network” tab, and refresh the page. In the list, you will find all the required resources, including fonts, images, and JS files, necessary for displaying the page correctly. The number of resources can be significant.
While JS improves user experience, it also presents challenges for search engine bots. If there are errors with JS resources on a page, Googlebot may render the page incorrectly. Moreover, in case of JS resource errors, the page may become inaccessible to the bot altogether.
What other problems can occur with JS resources?
There are several other issues that can arise with JS resources, impacting the performance and accessibility of your website. Let’s explore them in more detail.
- Large Number of JS Resources: Having an excessive number of JS resources can significantly degrade the overall page load time and page performance. This can have a negative impact on Core Web Vitals metrics, which measure crucial aspects of user experience and have an impact on your page ranking.
- Blocked JS Resources: If JS resources are inaccessible to search engine bots, such as when they are blocked by the robots.txt file, the page may not be displayed correctly in search engine results. While client browsers don’t consider the rules specified in robots.txt, search engines cannot load JS files that are blocked by this file.
- Non-200 Status Code JS Resources: JS resources that return a non-200 status code can cause delays in page loading. It is essential to ensure that all JS resources are properly loaded and return the appropriate status codes for optimal performance.
- Load Time of JS Resources: The load time of JS resources also plays a significant role in overall page performance. If JS resources are slow and they are loaded sequentially, it can lead to delays in rendering the page. Optimizing the load time of JS resources is crucial for providing a smooth user experience.
- Size of JS Resources: The size of JS resources is a critical factor in website optimization. Large JS files can slow down page loading times and negatively impact user experience. It is important to optimize the size of JS resources through techniques such as minification and compression to improve website performance. In general, the optimization of the JS size is one of the most important tasks for the website JS optimization.
To analyze and address these issues effectively, you can use JetOctopus. JetOctopus provides comprehensive analysis and insights into JS resource optimization, helping you identify and resolve any problems that may arise.
How to find problems with JS resources on your website
To identify and address issues with JS resources on your website, you can follow these steps using JetOctopus SEO crawler.
1. Start a JavaScript crawl: initiate a JavaScript crawl or select the JS crawl you want to analyze from the available list. You can easily identify JS crawlers as they are marked with a corresponding icon.
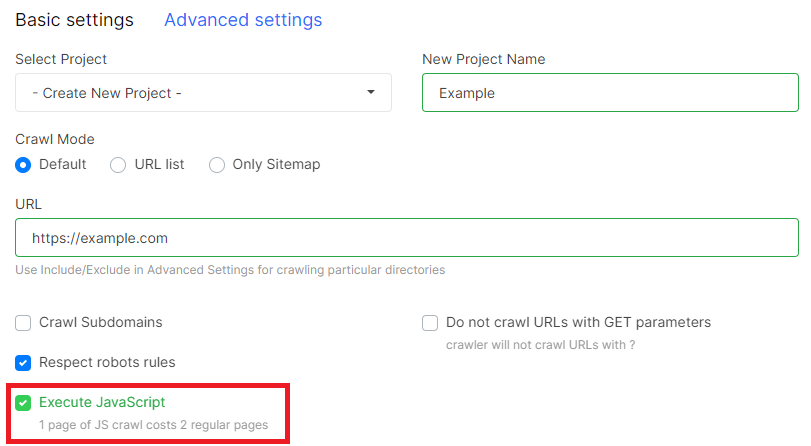
Wait for the crawl to complete. JetOctopus is a fast crawler, so you should receive results quickly, although the speed may vary depending on the number of pages and crawler settings.
2. Explore the “JS Requests” dashboard: once the crawl is complete, you will be presented with various dashboards. To analyze pages with JS requests and resources, navigate to the “JS Performance” – “JS Requests” dashboard. This dashboard contains essential data about JS page requests.
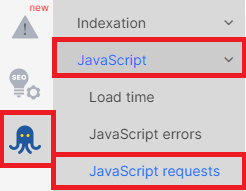
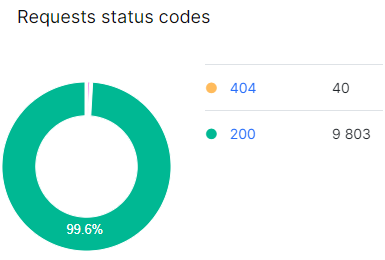
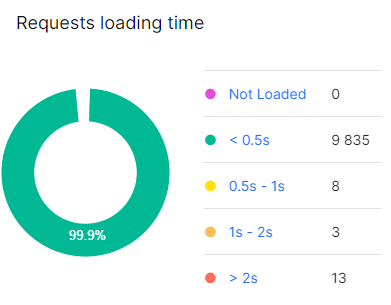
3. Analyze JS requests: pay attention to the various metrics provided in the “JS Requests” dashboard. You can analyze the average size of requests, their status codes, and loading time.
Focus on the “Requests Status Codes” chart, particularly non-200 JS resources. Clicking on a segment of the chart or a specific status code will take you to a detailed data table showing requests and pages where non-200 response codes were found.
Additionally, analyze slow requests by clicking on the corresponding segment of the chart “Requests loading time”.
4. Review the consolidated data table: in the “Pages’ Requests” consolidated table, you can find summarized data for all requests. This includes information about:
- how many pages the resource is loaded on,
- the maximum loading time,
- maximum size of the request,
- requests blocked by the robots.txt file.
Clickable columns in the table provide further insights.

We recommend paying special attention to the most heavy requests and most frequent requests.
5. Analyze request domains: pay attention to the request domains. If you use external resources for analytics, data collection, or customer communication scripts, analyze their load time and size. If an external resource is causing low page performance, consider finding alternatives.

6. Explore the “Requests Mime Types” table: examine the “Requests Mime Types” table, which lists all resources by type. Analyze the loading time and size of CSS files, fonts, and other elements. Optimizing these page elements can contribute to improved website performance.

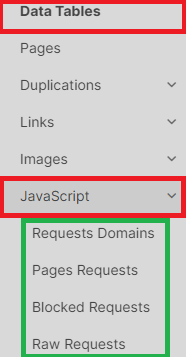
7. Dive into raw data tables: for a more in-depth analysis, navigate to the “Data Tables” -> “JS” section. Here, you’ll find all the raw data tables for further exploration.
8. Use filters in the “Pages” data table: in the “Pages” data table, you can apply filters and sort pages based on the number of JS resources or pages where JS resources failed to load. For example, to find pages with failed JS resources, select the filter “JS Resource Failed” – “> Greater than” – “0”. This will display a data table with pages where at least one JS resource returned a client error (4xx), a 5xx status code, or failed to load.
To do this, go to the “Pages” datatable and select the appropriate filter. For example, to find all pages with failed JS resources, select the filter “JS Resource Failed” – “> Greater than” – “0”. As a result, you will see a data table with pages, during the loading of which at least 1 JS resource returned a status code with a client error (4xx), a 5xx status code or did not load at all.
By following these steps and utilizing the features provided by JetOctopus, you can effectively identify and address problems related to JS resources on your website, optimizing performance and improving user experience.

