
How to compare crawls
JetOctopus represents a great opportunity to compare crawls. You can compare any crawls, not just the last two. This option is free and available to all users who use the JetOctopus crawling tool. LINK TO THE HOME
Read about the benefits of our crawl comparison tool in the article “Product Update: Compare Crawls”.
How to compare crawls in JetOctopus
The comparison option is presented in a separate menu “Compare crawls”. To do it, go to any crawl results and select the “Compare crawls” menu.
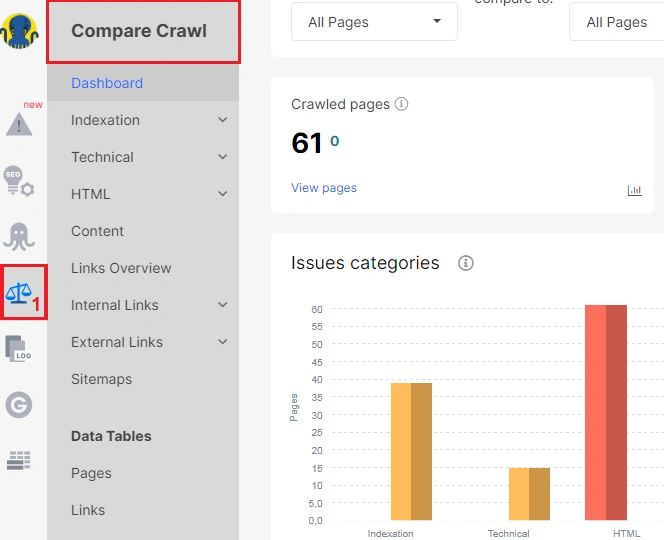
In the “Compare crawls” menu, you can find all the charts, reports and data tables that are available in the “Crawler” menu. You can see changes on your website in the form of visualizations and charts, as well as use raw data tables for analysis.
Note that you can compare crawls only from one project.
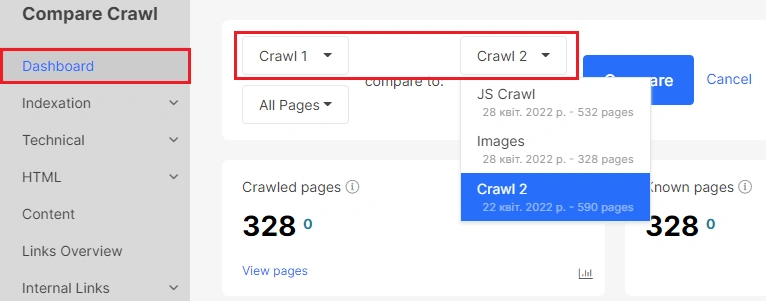
To select crawls for comparison, go to the “Dashboard” of the “Compare crawls” menu. Select the two crawls you want to compare from the top.
You can also select a segment of urls in each crawl for comparison.
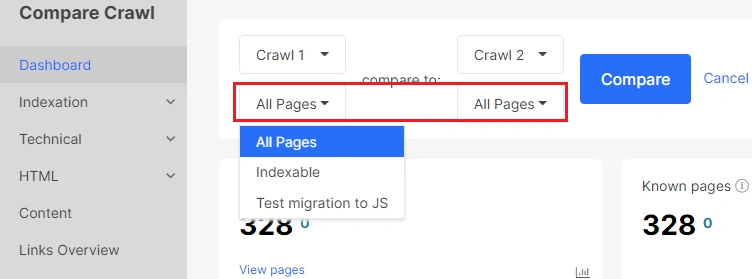
For a more accurate comparison, use crawls with the same or similar settings.
On the dashboard, you can find general information about the selected crawls. The first number corresponds to the data of the first crawl chosen above. Another number – to the second. Even if the selected crawls were run on opposite dates order, we will still display the data in the same order in which you selected the crawls for comparison.
Green color means a positive increase in percentage relative to the first crawl, red – negative.

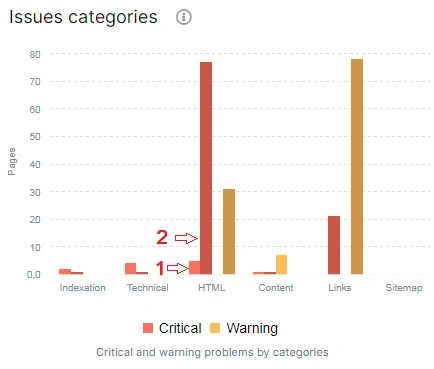
In the chart, you can see the dynamics of critical issues and warnings. In the screenshot below you can see that the number of critical issues during the second crawl has increased.
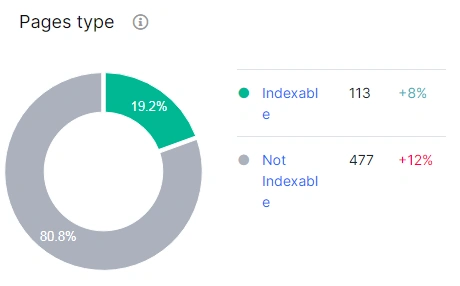
To see if the number of indexable pages has increased, go to the “Pages type” chart on the dashboard. We show the data for the first crawl on the chart, and next to it the percentages that show the difference between the two crawls.
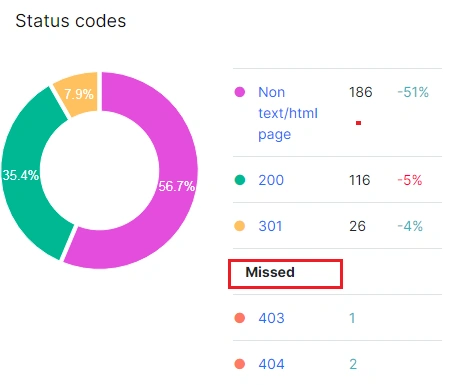
To see how the distribution of status codes has changed, go to the “Status codes” chart. If the number of pages with a certain status code changed during the second crawl, you will see next to the status code the percentage by which the number has changed. If there is no percentage next to the number of pages, then these status codes were only in the first crawl.
Missed status codes in the chart are those status codes that were not found in the first crawl, but were found in the second.
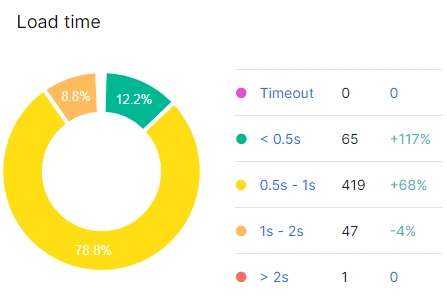
We also recommend comparing how the page load time has changed. This is an important metric for ranking pages in the SERP.
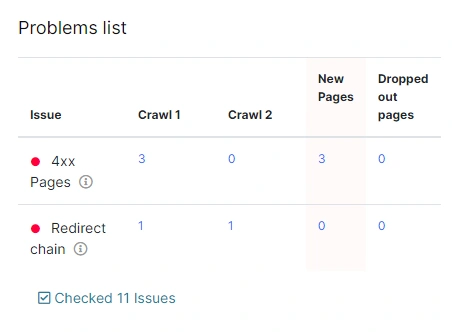
You can compare data from two crawls in any reports. For example, in the “Technical” – “Load Time” report you can see the common “Problems list” for two crawls. All data is clickable. If you click on the number next to the problem, you will go to the data table.
It is very convenient to work with data tables. You can customize data to display in the results. Select the first or second crawl. You can also select a segment of urls that have been found in both crawls: use the option “Exists in Both Crawls”.
“New Pages” comparison mode will show the urls that are in the second crawl, but they were not found in the first crawl.
The “Dropped out Pages” comparison mode will show those pages that were only in the first crawl.

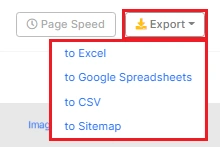
You can also customize the filters and columns you need. You can export the required data in a convenient format: CSV, Excel or Google Spreadsheets.
Why do you need to compare crawls
- To compare a staging and a live website
It is often necessary to compare test and production websites. Comparing the crawl of a staging and live site will help you build a working version without errors. Note that staging websites are usually more fragile, so you need to scan them very carefully. Also, staging websites are usually not a complete copy of a production website: they may have fewer pages, may be closed from indexing, and so on.
More information: “How to crawl a staging domain”
- To monitor progress
Most websites are very dynamic. If content and new urls are created constantly, it’s important to keep track of how the site is evolving and whether there are any errors on the new pages. For example, you need to check if new pages are open for indexing and if they have the correct hreflang attributes.
- To check updates
It is very convenient that you can compare the previous version of the website with the current one after the release. Thanks to this comparison, you can quickly detect bugs. Also, comparison of crawls is a very valuable tool that allows you to track changes in performance and speed of the site after updates.
- To conduct A/B testing
A/B testing in SEO is performed through changes in SEO-important elements. For example, you can see how the clicks change with different types of descriptions. And thanks to the comparison of crawls, you can easily monitor the testing and control segments, as well as check the implementation of the AB test.
- To compare mobile and desktop versions
It is very important to check that all SEO directives are the same on the mobile version, because of the Mobile First Indexing algorithm. You can compare the difference between your desktop and mobile versions by choosing different user agents when configuring a crawling. Search engines admit a little difference between the desktop and mobile versions. However, the mobile version must contain everything that affects indexing and ranking: metadata, canonicals, indexing rules, content, images and their attributes, and so on.
More information: “How to configure crawl and change the user-agent”.
- To deeply compare JavaScript and HTML versions
JetOctopus allows you to compare HTML and JS versions within a one crawl. However, it is much more convenient to use all the tables and graphs for a more detailed comparison.


