Technical SEO audits have a reputation for being overwhelming. Pull the wrong tool and you end up with a spreadsheet of 47 issues ranked by severity, with no clear sense of what Google actually cares about on your specific site. The problem isn’t the data – it’s the gaps between data sources.
JetOctopus gives you a crawler, log file analysis and Google Search Console integration in a single workflow, which changes not just how fast you audit, but what you’re able to see. A broken internal link is one thing. A broken internal link on a page that receives 3,000 monthly GSC impressions and is barely crawled by Googlebot is a priority. The scale of the problem is bigger than most teams assume: JetOctopus’ long-term log research shows that on average 40-60% of pages on large sites are never crawled by Googlebot at all.
This guide walks through a complete technical site audit using JetOctopus from project setup to ongoing monitoring, so you leave with a clear, prioritized action list, not just a list of problems.
Key Takeaways
- JetOctopus combines a crawler, log file analyzer, GSC and GA4 integration in one platform and this combination is what makes it possible to connect technical issues directly to search performance data
- Set up log streaming and connect GSC for your first complete audit. Partial crawls and retrofitting these data sources will leave you without performance context and you won’t be able to see the whole picture
- Configure custom extraction rules before crawling
- Duplicate content detection in JetOctopus is more granular than most tools: separate signals exist for titles, meta descriptions, H1s, full HTML and word fingerprints – each filterable to indexable pages only
- Log analysis goes beyond Googlebot: JetOctopus identifies AI training crawlers, AI search bots and spoofed Googlebot traffic separately, giving a complete picture of who is actually crawling your site
- Prioritization is built into the workflow – every issue can be cross-referenced with GSC and GA4 before a single line of a dev ticket is written
- Crawling staging environments before releases is one of the highest-ROI uses of the platform – catching noindex tags, redirect misconfigurations and broken links before they go live
Setting Up and Running Your First Crawl
Before JetOctopus can show you anything useful, three connections need to be in place: your crawl configuration, your sitemap and your log data source. Getting these right from the start determines the quality of everything downstream.
Configure your crawl settings carefully. The key decisions are:
- User-agent: default to Googlebot Mobile. Only switch to Desktop if you have a specific reason, such as auditing a site that serves a different experience to desktop bots.
- JavaScript rendering: JetOctopus doesn’t just return a rendered page – it gives you a full diagnostic breakdown including JS errors, total requests fired, failed requests and resources blocked by robots.txt.
- Crawl speed: set this conservatively for production sites. Respect server limits.
- Crawl images: enable this to audit images at scale – broken image links, missing alt texts and oversized files that slow pages down.
- Add your sitemap URL or JetOctopus will fetch a sitemap URL from yout robots.txt file.
- Configure custom extraction rules before you launch. If there are page-level data points you want to capture – price, stock status, publication date – define these extraction rules at this stage.
JetOctopus will crawl HTML pages, JavaScript resources, images, CSS and all internal and external links. For large sites, the platform handles millions of URLs without any sampling.
Core Technical Audit Areas
With the crawl complete and logs flowing, you have a full picture of your site across three data sources. Work through these audit areas systematically, using the principle: What to check → Where to find it in JetOctopus → What bad looks like → What to do about it.
Indexability and Crawlability
Start here. Everything else – content quality, structured data, performance – is less of importance if Googlebot and AI bots can’t reach and crawl your pages. Even the biggest platforms hit this wall: Depositphotos, with 150 million+ pages, found that only around 20% of them were indexed by Google before an audit uncovered the root cause.
SEO Efficiency
SEO efficiency is where the crawler data,server logs data and GSC data intersect. The question isn’t “what part of my website is interlinked, reachable by crawlers and gains organic impressions for the same 30 days window?” but:
- “Why is Googlebot spending its time elsewhere, but not on indexable pages?”
- “Why a part of my pages were not crawled by Googlebot for the last 30 or 90 days?”
- “Why some pages are crawled but still don’t rank?”
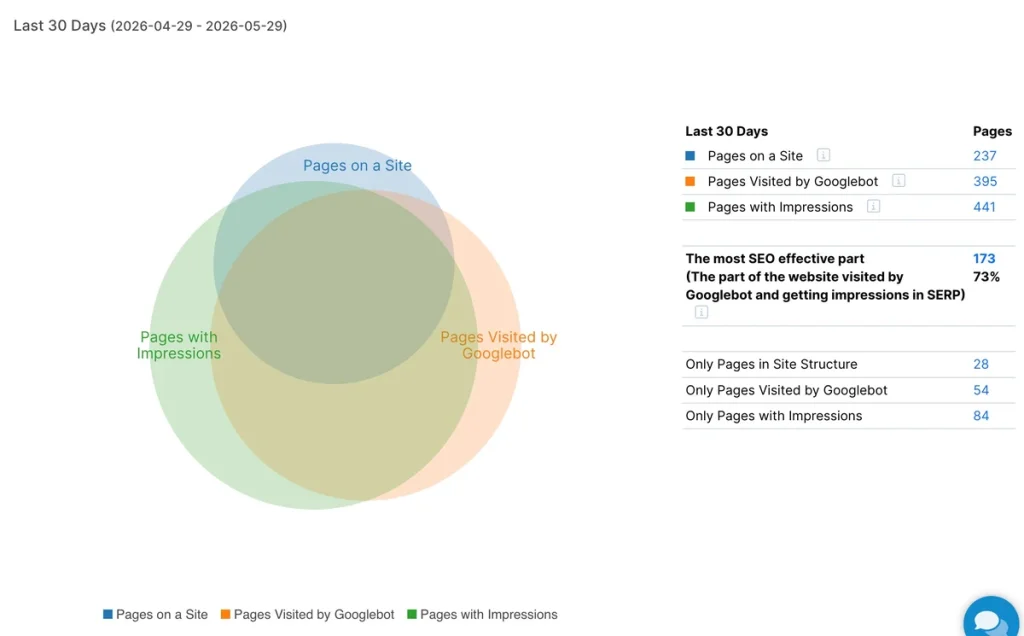
Cross-reference Googlebot crawl frequency from the logs with GSC impressions from the page-level data. Pages with high impressions that Googlebot rarely visits deserve attention: they’re important to Google, but something in your architecture or crawl configuration is limiting access. Conversely, pages with high Googlebot crawl frequency and zero impressions are burning crawl budget without return.
GSC tells you how pages perform in search results, but the story ends at the click. To understand what happens after it – sessions, engagement, conversions and revenue – you need analytics data joined to the same URLs, in the same interface, filterable by the same technical signals.
Merging GA4 data with JetOctopus crawl, website logs and GSC can deepen the analysis even further:
- “Why some of the pages rank well, but don’t generate revenue?”
- “There is a huge amount of pages with 70% duplicated content, where Googlebot is spending a log of crawling budget and than don’t convert”
AI Efficiency
AI crawlers are now a measurable part of server load and JetOctopus surfaces them with the same specificity as search bot analysis. So here, the core idea is almost the same as in SEO efficiency, just with different bots: cross-reference your crawl data with the visits of OpenAI, Perplexity or Anthropic search bot from the logs. Which indexable pages do their search and user bots (ChatGPT-User, Perplexity-User, Claude-User) request when answering real user questions, which pages do they never touch and where are they spending requests on URLs that carry no SEO or AI visibility value? Sections that these bots never visit won’t be cited in AI answers, no matter how well they rank in classic SERPs.
Architecture
Once you know what’s indexable, audit how efficiently the architecture serves it.
Filter pages by status code to surface your full HTTP status breakdown. Investigate any 4xx and 5xx pages and pay particular attention to soft 404s – pages returning a 200 status but serving thin or error-like content that JetOctopus flags as problematic.
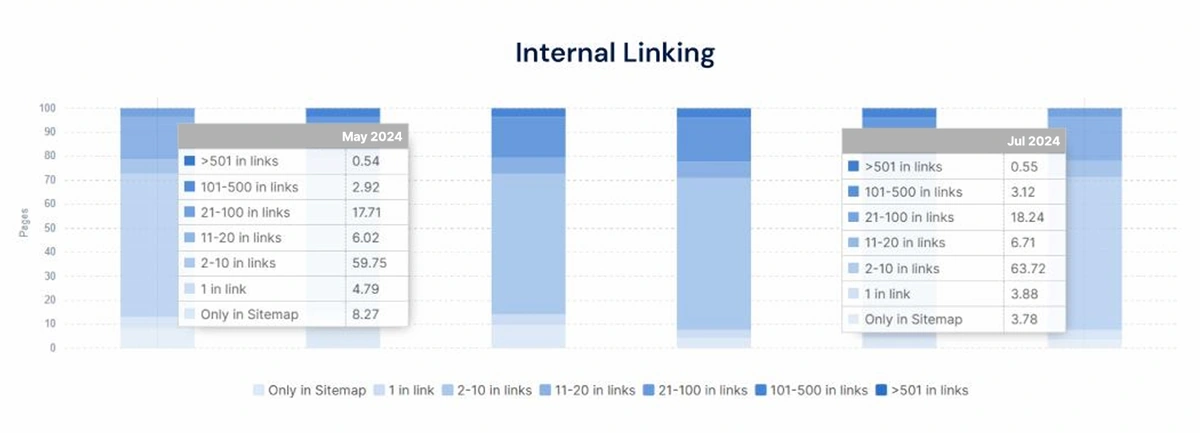
Internal link distribution shows the same problem from a link equity angle. Filter crawled pages by the number of internal dofollow links to surface true orphans: pages Googlebot can reach but that receive no PR from the rest of the site. These pages often rank poorly not because of content quality but because of structural neglect. The scale can be staggering: TemplateMonster discovered 3 million orphaned pages outside the site structure that Googlebot kept visiting – plus another 250K low-value pages inside it – draining crawl budget for years before log analysis surfaced the problem.
Slow HTML Load Times and 5xx Responses
Both problems influence not only rankings but crawling itself. Googlebot adjusts its crawl rate to your server’s response speed: when HTML takes too long to load, the bot simply requests fewer pages per day. And when it hits 5xx errors and a 429 response code, it backs off even harder – persistent server errors signal an unstable site and Googlebot cuts the crawl rate to avoid making things worse. We assume the same applies to AI bots: slow responses and server errors mean fewer pages fetched and less of your content available for AI answers.
Check 5xx pages in both places JetOctopus surfaces them: in the crawl (pages that returned a server error to the crawler) and in the logs (URLs where real Googlebot and AI bot requests hit 5xx responses – including URLs your crawl never reached). Filter pages by load time to find slow templates and sections – a category tree that consistently responds in 2+ seconds is quietly capping how much of your site gets crawled. Fixing server response time and eliminating 5xx errors on high-traffic templates is often the cheapest crawl budget win available.
Content and Duplicate Issues
Duplicate content in JetOctopus is granular: rather than a single duplicate flag, you get separate signals for titles, meta descriptions, H1 and h2 tags if any of those are:
- Duplicate
- Empty
- Too short or too short
As well as full HTML duplicates and content similarity at word level. Cleaning this up pays off: a travel marketplace with 300,000+ pages eliminated around 100,000 fully duplicated pages – contributing to a 250% jump in keyword rankings and a 20% SEO traffic increase within a year.
Thin content is assessed too, by combining word count with GSC impressions. Low word count alone isn’t actionable – plenty of thin pages serve legitimate functions. That said thin pages with low search impressions are candidates for consolidation or removal.
Each of these is available across all segments and page types and be merged with any custom data imported by a user. The indexable-only filter is the one that matters most: it shows you what Google is actually comparing, stripping out non-indexable pages that would inflate the duplicate count. Non-indexable duplicates are important too – keep in mind that all kinds of crawlers may may spend too much crawling budget on those pages, rather than searching for new pages and content updates on old ones.
But the most important for both search and AI bots is JS-rendered content. In 2026 AI crawlers don’t execute JavaScript at all and Googlebot renders it with a delay (weeks or could be even months) and at a cost, so any content, internal links or meta tags injected client-side may simply not exist for the bots you care about. If key content only appears after rendering, it is invisible to all AI bots by default. The only AI bot that might still have access to JS rendered content is Gemini since it has access to Google’s index.
Page Experience and Performance
JetOctopus captures crawler-measured load time and full JS render time per page. These aren’t Core Web Vitals scores – they’re server response and rendering metrics as seen by the crawler, which makes them a scalable proxy for identifying slow templates or consistently heavy pages across the whole site before Google gathers the statistics to display CWV metrics. Use them to triage: pages or templates that are systematically slow are worth pushing into PageSpeed Insights or CrUX for full CWV investigation. Especially great to see the data on staging domains, before you release changes on production.
With JetOctopus you can separately launch a CWV check, where all the data will be extracted by Google API, so you will get field data to compare with your JS execution and HTML load tie metrics.
The mobile-first crawl (run with Googlebot Mobile user-agent by default) surfaces mobile usability issues that would be invisible in a desktop crawl: viewport misconfiguration, font size violations, tap targets that are too small or too close together. These aren’t just UX issues – Google’s mobile-first indexing means these directly affect how the mobile version of your page is indexed.
JavaScript Rendering
Run a JS crawl and compare each page type – JS-rendered vs HTML-only versions. Pages that appear to have normal word counts in the JS crawl but near-zero content in the non-JS crawl are red flags: their content is invisible to Googlebot unless it fully renders them, which isn’t guaranteed at scale.
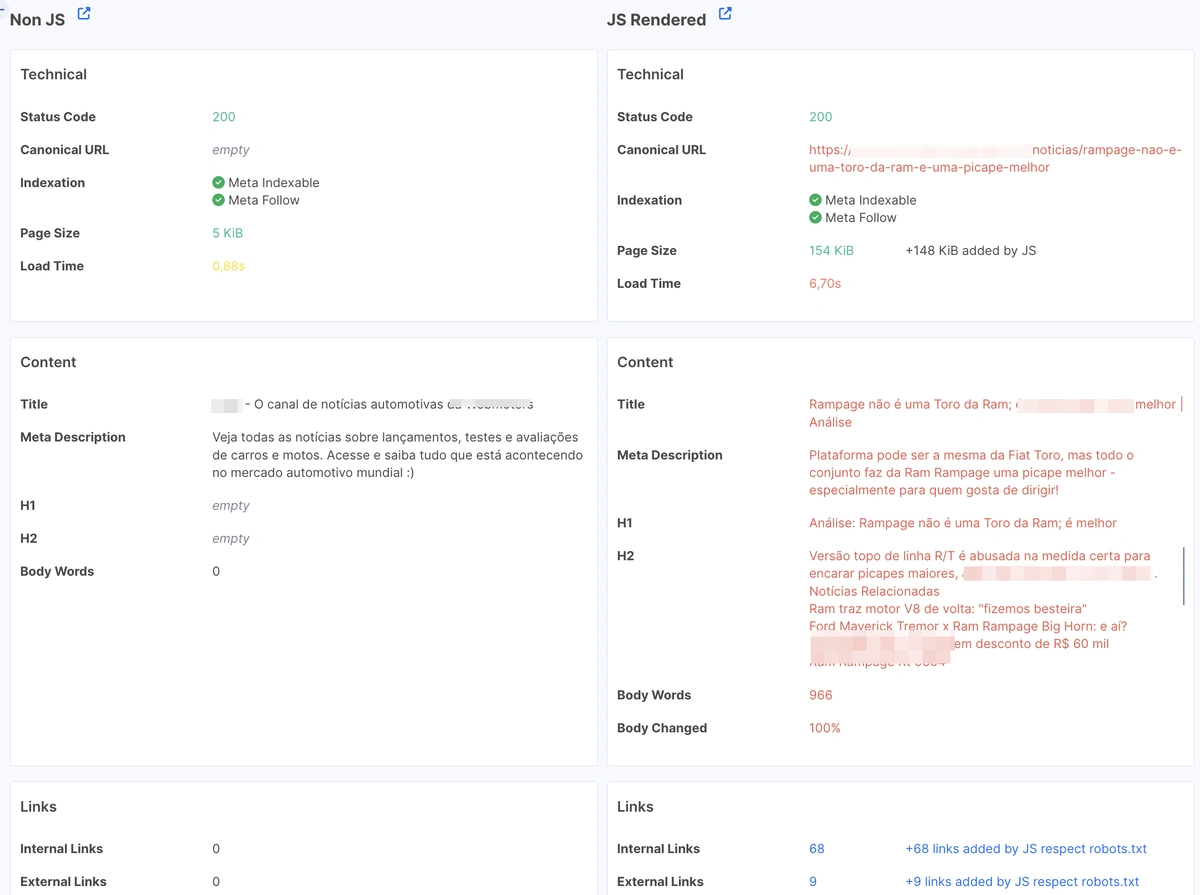
Besides that, JS can modify internal links, indexation related tags (meta noindex and canonical), hreflangs, title and meta descriptions, which are vital not only for SEO, but for AEO/GEO too.
Structured Data
JetOctopus extracts structured data natively during the crawl – schema types, individual schema items and any validation errors – without requiring a separate tool. For JavaScript-heavy sites, there’s an additional field worth checking: whether each schema item was added by JavaScript. If your structured data is entirely JS-injected, a non-rendering crawler (or an under-resourced Googlebot crawl) won’t see it at all.
Log File Analysis: The JetOctopus Superpower
A crawler tells you the state of your site. Log files tell you how Google and AI bots actually behave on it and their behaviour usually doesn’t match.
Log streaming is the recommended setup: connect your server logs (Apache, Nginx, CDN-level logs) directly to JetOctopus so Googlebot data is continuously available. For one-off analysis or auditing a historical period, a log file upload works as an alternative.
For news and publisher sites, the speed at which Googlebot picks up fresh content is the metric that matters most. Distractify, a publisher with millions of pages, uses the Log Analyzer to track exactly how fast Googlebot crawls new articles – and grew Googlebot visits 5x in a year, with Google News pages up 54% and Google News impressions up 16%.
With logs connected, the most impactful analysis is the combination view: overlaying crawler data, log data and GSC data on the same URL set. The key segmentation is:
- Constantly crawled by Googlebot and JetOctopus and ranking in SERPs: healthy baseline
- Crawled by JetOctopus but not by Googlebot: these pages exist but Google isn’t visiting them – a crawl budget or internal linking problem
- Crawled by Googlebot but not ranking: Google visits but doesn’t commit – likely a quality or signals issue
- Exists in JetOctopus crawl, but not visited by Googlebot and doesn’t rank: declared to Google, but entirely off its radar
Similar applies to AI bots and visibility:
- Pages visited by AI search bots and existing in JetOctopus crawl, but not visited by AI user bots: looks like AI agents didn’t find any useful content to show within answers
- Pages in JetOctopus crawl, but not visited by any kind of AI bot: the worst scenario nowadays
Beyond Googlebot, JetOctopus’s bot identification goes deeper than user-agent parsing. Googlebot Desktop and Mobile are tracked separately. This matters when you’re trying to understand why your images aren’t appearing in Google Images for example.
Googlebot response time per URL is also logged, making it possible to identify specific templates or page types where the server is slow to respond to the crawler – separate from user-facing performance.
Additionally, it’s always a great idea to check “other” bots crawling your site:
- JetOctopus does a reverse IP lookup so you’ll know if someone disguised as Googlebot or Bingbot, for example, crawls your website
- Marketing bots and web scrapers may drain too much of your server resources. Keep an eye on them
Crawl budget spent
The Impact hub in JetOctopus has a dedicated Crawl budget report that answers the question directly. It combines JetOctopus crawl data with server logs to show exactly how bot attention is distributed: how much activity lands on indexable pages vs redirects, 404s, slow or non-indexable URLs. Every hit on such a URL is crawling budget that could have gone to a page you actually want ranked. And this applies not only to Googlebot – AI search bots from OpenAI, Perplexity and Anthropic operate with far smaller crawl capacity, so every request they waste on a redirect or a dead page is a bigger relative loss. Keep in mind that AI bots heavily rely on XML sitemaps to discover content, which makes a clean, up-to-date sitemap even more important than it used to be.
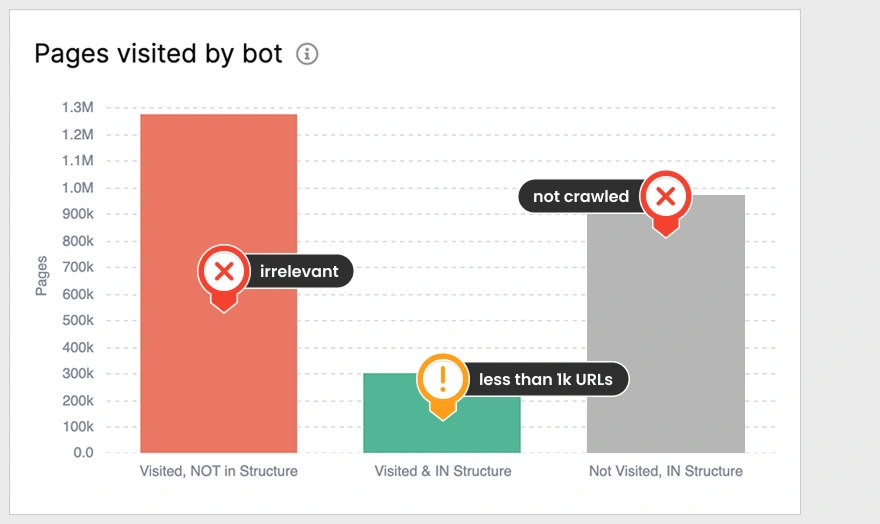
The report highlights the share of wasted budget and the exact URL groups responsible, so instead of guessing where the leak is, you get a ranked list of what to fix – typically redirect chains, parameter URLs and orphaned sections that bots keep revisiting. This is exactly the workflow RIA.com used across its five classifieds products with millions of pages each: after making crawl budget optimization a priority, Googlebot crawling tripled, bot visits and visited pages doubled and the number of new pages discovered by Googlebot grew by 200%.
GSC Integration: Connecting Crawl Data to Search Performance
Google Search Console data in JetOctopus operates at two levels and both matter.
Page-level GSC data gives you clicks, impressions, CTR and average position for every URL – with device breakdowns for desktop, mobile and tablet separately. This is the layer that turns crawl issues into priorities: a missing H1 on a page with 50 monthly impressions is a low-priority fix; the same issue on a page with 5,000 impressions is not.
Query-level GSC data goes one step further, attaching keyword-level performance to individual pages. You can see which queries drive traffic to which URLs, including query length and word count – useful for understanding whether your content is being matched to the right intent or whether long-tail pages are capturing traffic they weren’t designed for.
And that’s not it: JetOctopus merges the data sets and you have precise page performance per each keyword with all classical GSC metrics. And don’t forget that with JetOctopus, all your data is stored longer than 16 month!
The table below shows some of the most useful cross-source combinations in JetOctopus and what each one is designed to find:
| Crawl Signal | GSC Signal | What it surfaces |
| is_indexable = 1, googlebot visits > 0 (logs) | all_impressions = 0 | Indexable pages crawled by Googlebot, but not ranking (0 impressions) |
| words_count < 250 | all_clicks > 0 | Thin content pages driving traffic – expand or consolidate |
| count_in_links_dofollow = 0 | all_impressions > 500 | Orphan pages with real search visibility – fix internal linking |
| count_title_idx_dup > 0 or count_html_dup > 0 | all_impressions > 0 | Pages in SERPs having content duplication issues (or even cannibalization) |
| AI search bot visits > 0 (logs) | 1 or fewer unique queries per page | Pages crawled by AI search bots, but not gaining any query fan-outs |
Use the device split to validate mobile-first indexing: a page that ranks well on desktop but poorly on mobile, after a Googlebot Mobile crawl, points toward a rendering or content parity gap between the two versions.
JetOctopus also integrates GA4, adding the behavioral layer on top of search data: sessions, engagement and conversions per URL, joined to the same crawl, log and GSC dataset. This closes the loop from technical issue to business impact – you can see not just which pages rank, but which ranking pages fail to convert and whether a technical problem (slow load, thin or duplicate content) sits behind it.
Prioritizing Issues: The Audit Matrix
A complete audit will surface more issues than any team can fix at once. Prioritization is not optional – it’s the key to a step-by-step implementation and results.
The framework is simple: score every issue category by impact (the volume of organic impressions or clicks, the amount of the pages affected, the total volume of revenue the pages generate) against effort (development complexity, content volume affected, teams or people needed for implementation).
High impact, low effort – fix immediately:
- Redirect chains
- Canonical tags pointing to 404 or redirected URLs
- CSS or JS resources blocked in robots.txt
- Missing hreflang tags
- Non-canonical URLs ranking
- Indexable pages with no internal dofollow links
- Issues with schema markup
- Pages draining crawl budget
High impact, high effort – plan and schedule:
- Site architecture overhaul (crawl depth, silo restructuring)
- JavaScript rendering issues (requires development)
- Breadcrumb restructuring across large site sections
- Too heavy images
- JS-heavy pages
- Soft 404 pages
Low impact, fix when capacity allows:
- Server resources spent on non-vital crawlers
- Meta description length optimization
- Similar title and H1 tags
- Minor title tag variations on low-impression pages
Setting Up Ongoing Monitoring
A site audit is not a one-time event. Sites change – new templates get deployed, CMS updates shift canonical behavior, developers add noindex tags that were meant for staging. The monitoring layer is what ensures you catch these changes before they compound.
JetOctopus supports automatic crawl scheduling out of the box. This isn’t something you configure from scratch – it’s a built-in cadence that keeps a rolling history of your site’s technical state without requiring manual crawl launches.
You can also crawl staging domains as part of your pre-release process. Before any significant deployment, run a JetOctopus crawl against your staging environment to catch issues before they reach production and influence your visibility and revenue.
Configure alerts for the signals that matter most: sudden spikes in 5xx status codes, a drop in the count of indexable pages, Googlebot’s crawling or rankings decline. These alerts are the difference between proactive technical SEO and reactive damage control. The payoff is measurable: RIA.com’s team detects critical problems 2-3x faster with log-based alerts and Raw Logs monitoring, while Distractify’s bi-weekly health checks caught a sudden 404 spike caused by broken embeds before it produced any traffic drop.
Make crawl comparisons and use MCP for this. Check those most chronic issues draining you visibility and revenue vs those that were fixed and their influence. Now it’s possible to answer questions every stakeholder eventually asks in minutes.
With log streaming running continuously and GSC and GA4 data pulling on a regular cycle, ongoing monitoring in JetOctopus becomes less of a manual audit process and more of a standing diagnostic layer – one that surfaces issues as they emerge rather than weeks after the fact.
Conclusion
A JetOctopus audit follows a clear sequence: configure and crawl → analyze logs → cross-reference GSC and GA4 → prioritize → fix → monitor. What makes that sequence more powerful than a generic audit workflow is the data density at each step – crawler diagnostics that go down to JS request level, log analysis that distinguishes real Googlebot from spoofed traffic and GSC data that attaches search performance to every URL and keyword.
The result is not just and audit – it’s a prioritized list of all website-related issues with an action plan.
And this workflow holds up over years, not quarters: teams like RIA.com have run it for seven years, while Swiss Marketplace Group has managed its multimillion-page, multilingual marketplaces on JetOctopus for 3+ years – reporting +350% Googlebot visits and +700% SERP impressions along the way.
If you want to see what this looks like on your own site, book a demo and we’ll walk through it together.