Google Search Console is a free tool that is given by Google to help SEOs measure and optimize. But, if you have a Data Scientist’s perspective, you will shortly notice that Google Search Console only gives the basic data without processing the SEO Insights and data-driven SEO Approach.
Using query refinement, device, URL, and time filtering can be useful but to create an actionable SEO Insight in scale, a Google Search Console module that automates Data Analysis and Visualization along with blending GSC Data with other SEO related sections is important.
Thus, JetOctopus has a state-of-the-art Google Search Console SEO Insight Extractor with more than hundreds of data combinations and visualization charts. Step by step, we will go through Google Search Console’s data and how to use it for SEO in a scalable way.
Overview Section of Google Search Console Module
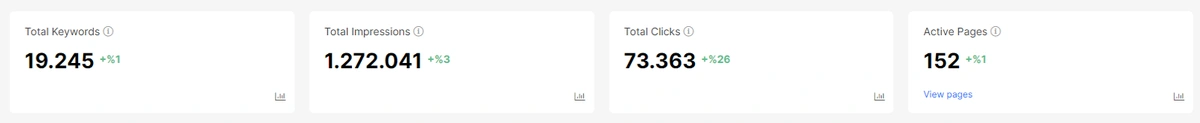
The first section of JetOctopus’ Google Search Console Module is the general data gatherer. In a normal Google Search Console, you can’t see all the general data on a single page, you need to click other tabs to see other sections such as “device”, “country”, “search appearance”.

In other SEO Technologies, most of them don’t show the “device based performance” for a period of time, or how many pages produced, how many clicks along with what is the query amount has been ranked. But, in JetOctopus’ Search Console module, these are just the initial sections.
Note: In Google Search Console, you can’t download more than 1.000 queries. In the GSC API, the limit is 4.000. But in JetOctopus, you can collect all queries and every related data dimension per query such as URL, impression, click, date, position, device, and region.
Ranking Visibility Section for Understanding the Hidden Potential of a Website
Every website has an unused ranking potential. Some of these potentials come from easy-to-fix problems and some come from harder to fix signals. To quickly determine and locate these potential fixes, finding the “underperforming pages” on a daily basis is important.
Below, you will see the “Ranking Visibility” chart. This section is important because you will notice that “what percent of the web site” produce this level of traffic. If you have “100.000” pages but only “15.000” of them producing actual organic clicks, it means that you are hindering your website’s organic search potential.
In this example, we produce an average of 36.000 organic clicks per day with between 14.900 and 14.400 web pages. But, how many pages does this website have? Between you and me, it is more than 500.000. It means that the web site’s “productivity” is so low and it consumes the crawl budget and bandwidth of the search engine for usually, nothing.
Finding “underperforming web pages” and poor quality pages is important because they also decrease the potential of neighbors’ content. Below, you will see a worse example.
Most of the websites on the web don’t use all of their ranking power and potential. Thus, I also recommend you to learn about “Ranking Signal Dilution” which includes a real-world SEO Case Study that I published with JetOctopus.
I know that you wonder what are the new queries earned or lost or which pages produced these clicks and which pages are not clicked. We will cover these too.
Quick Performance Observation
Google Search Console doesn’t show the “click, impression and CTR” based on different dates on its own “graphical interface”. You can collect this data with Google Search Console API. In JetOctopus’ Google Search Console Module, it is one of the fundamentals. Below, you will see the general performance report within multi-Y axes and line graph.
You see that we have Click, Impression, and CTR information. If you want to see a dimension with more details, you can “unclick” the other dimensions. Below, you will see the only click data and its line plot within an interactive way.
Performance Observation based on Device and Time
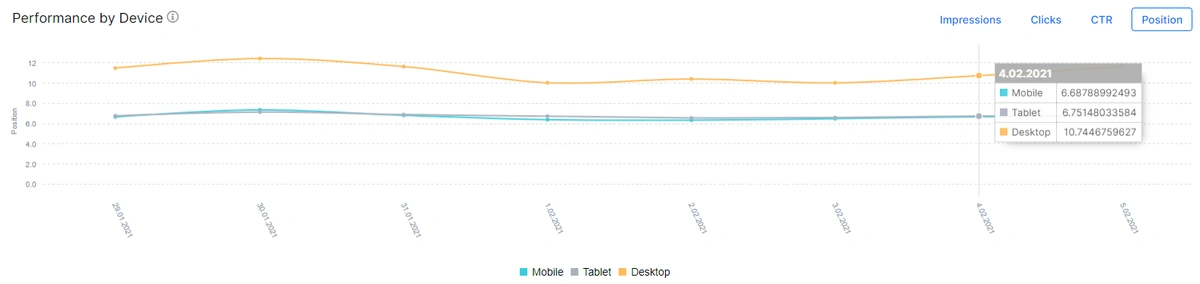
Like in the Quick Performance Observation section, also observing the device-based click, impression, CTR, and Position data is an easy task thanks to JetOctopus. Below, you will see the “Impression” performance based on device types for the last 30 days.
In this example, 55% of the impressions mostly come from mobile devices. Also, we have more than 20.000 impressions from tablets every day. Another good thing about JetOctopus is that it doesn’t create different charts for every data combination, instead, it “dynamically changes the existing plot” according to your choices. Below, you will see that I interactively change the existing chart with “clicks, CTR, and position” data.
While choosing the different data dimensions, you can change the graph. And, thanks to this quick modification, I can realize that the lowest CTR for the last 30 days is coming from the “tablets”.
You also can check the tablet’s device types, session duration, and conversion rate so that you can understand what would be the “profitable output” of performing optimization for the tablets. And, we see that the lowest Average Position is coming from desktops.
This website is an e-commerce book store, and also it uses AMP for mobile pages and search results pages. Does this mean that AMP has boosted their rankings for mobile devices? You may ask the brand when they have implemented the AMP and check the difference or you may try to see how AMP decreased the web pages’ size and improved the speed. But, we won’t focus on a single website’s analysis here, so we should continue.
Organic Search Data per Device Type
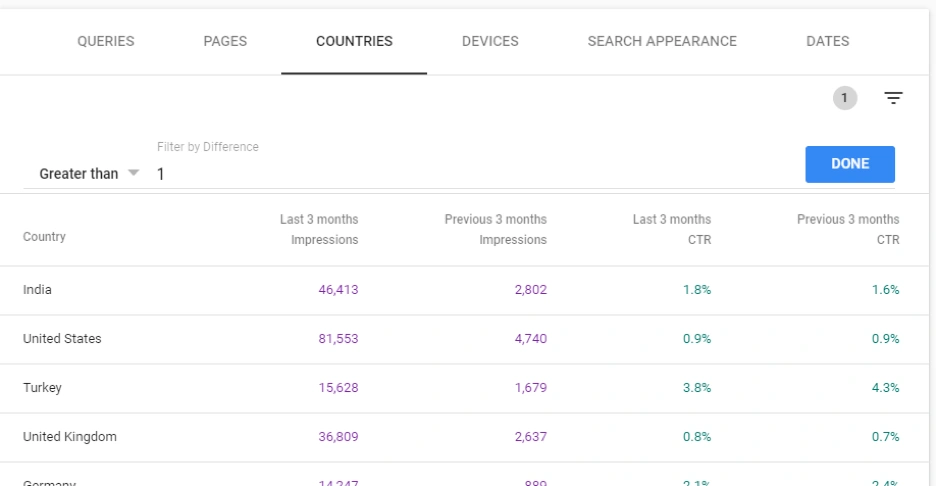
In Google Search Console, we have data for device types for different data dimensions such as Impressions, Clicks, CTR and Position. But, having a smoother interface is making the same data more efficient to be absorbed by the SEOs. So, in other words, Data Visualization is important to understand the same data in a better way.
Above, you will see a short video that shows the JetOctopus’ quick observation within a frame for device types and their relations to the Impressions, Clicks, CTR and Position. Brief, interactive and precise. And, below you will see the raw version of Google Search Console.
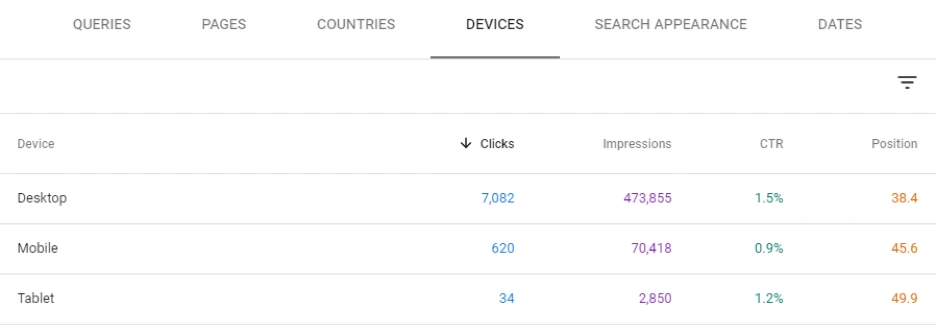
Same data but it is not brief and visually interactive at the same level.
Organic Search Data per Country
Overview Section of JetOctopus’ Google Search Console Module’s last section is Organic Search Data per Country. A similar situation is also valid here like in Organic Search Data per Device Type.
This is the raw data visualization from Google Search Console.
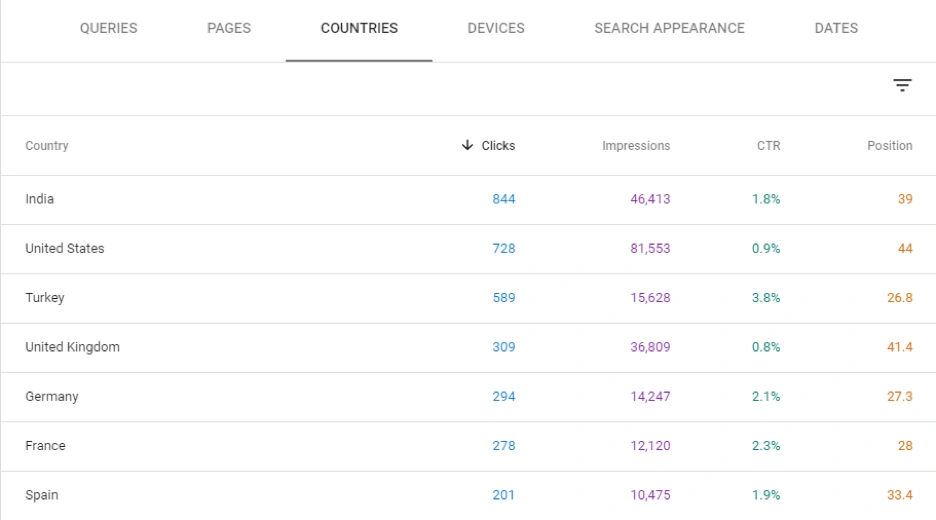
Below, you will see the Data Visualization’s effect on data inspection.
According to the data dimension’s character, we have pie charts or bar charts with an interactive visualization. It is easier to make your customers to examine and absorb the insights from here.
Dynamics Section of Google Search Console Module of JetOctopus
The Dynamics Section of Google Search Console Module from JetOctopus includes more important insights for an SEO in terms of organic visibility and performance.

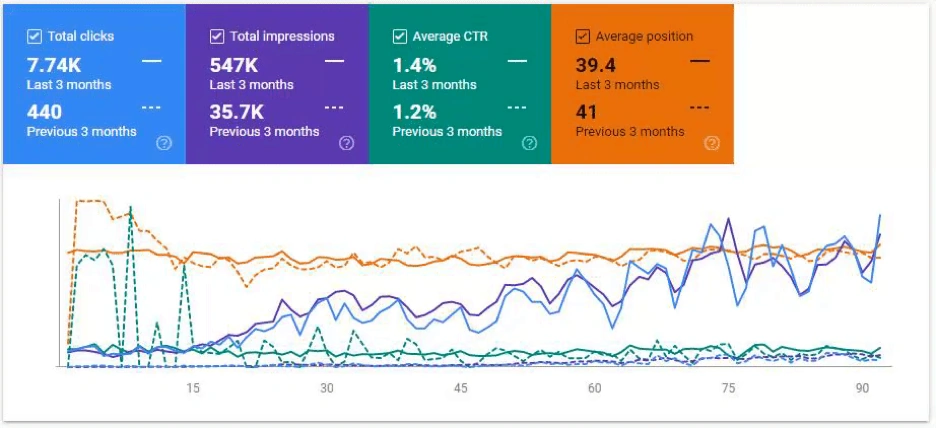
Above, you see a quick performance comparison card at the above section. For this example, we have %32 more queries we have ranked for with the sum of 5.706. And, we also see the click, impression and position changes with their end situation.
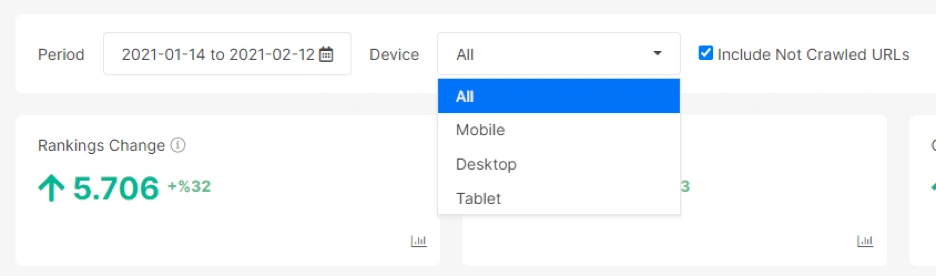
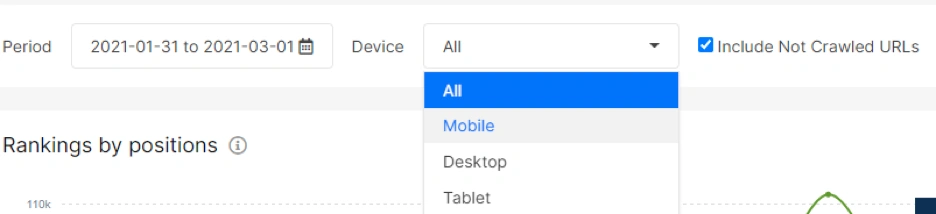
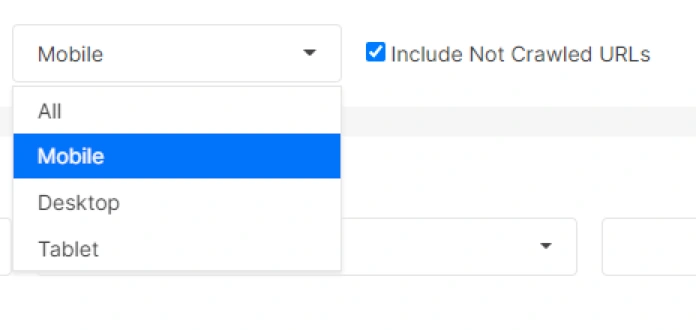
I might forget to mention but of course, you can choose whichever device you want and whichever the date you want.
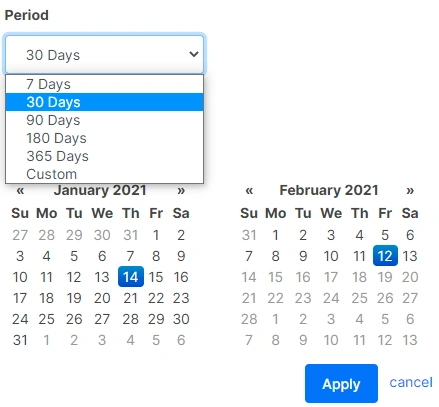
And, you will have quick date filters along with the custom date preferences. Now, we can move further and get some quick insights for our example project here.
Performance Comparison Section of Dynamics from GSC Module
Before putting a definition sentence here, let’s look at the Google Search Console’s raw comparison graphic.
And you will see the visualization for the comparison between the previous period and the current period in terms of clicks, impressions, CTR and positions.
So, let’s ask three questions.
- Which one is more clear?
- Which one is more descriptive?
- Which one is more distinctive?
For these questions, I vote for JetOctopus’ design. I know that Google’s Google Search Console team spends great effort for these things and they have plenty of improvements for every month. But, still this won’t change the output of this comparison.
Same information can be more insightful with a better and quicker visualization.
Also, I am a color-blind, so I can say that color-contrast difference is actually better in JetOctopus’ version.
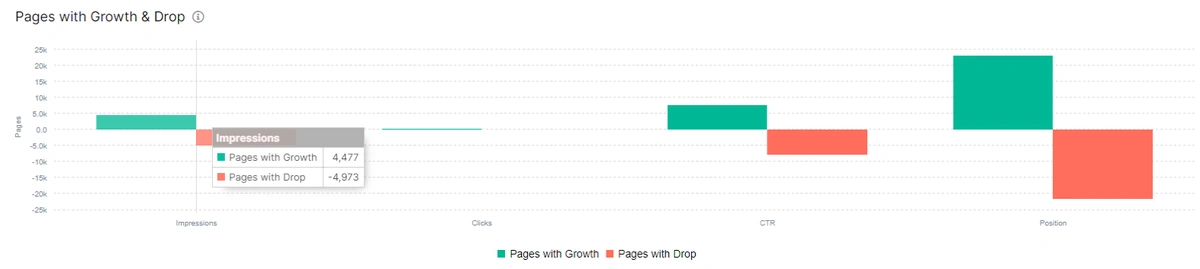
Pages with Growth and Drop Comparison from JetOctopus
Pages with growth and drop sections show the pages with a better and worse organic performance according to the previous period. Below you will see the pages with positive and negative changes in terms of impressions, clicks, CTR and positions.
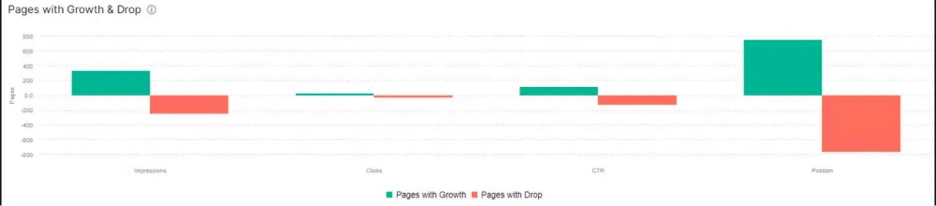
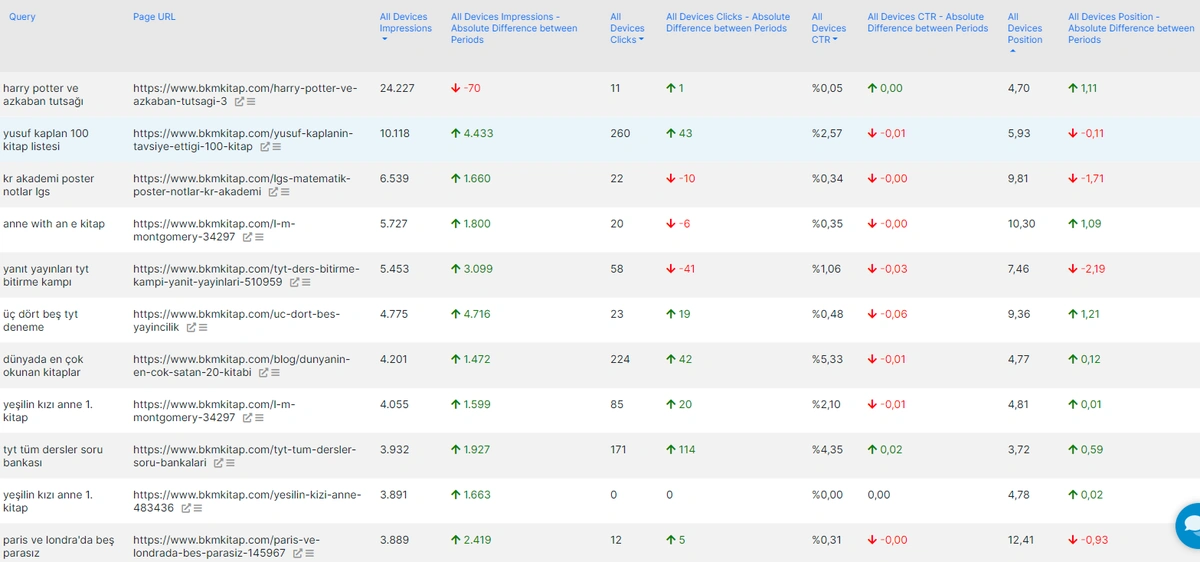
What happens if you click one of these? You will have the filtered page URLs along with their Search Console information and beyond within a table.
But, I will show this more detailed way within the section of “Data Filtering and Exporting”. In this example, we filtered all the pages to have more impression than the previous period.
To use this kind of a feature from Google Search Console, you will need to use a “filter” system with a long click path, and still it won’t be so effective or broad. Because, in JetOctopus you can blend the data from other sources with GSC data.
And, if you have more rows, your browser will start to slow down in the raw Google Search Console. It is still useful but not better than JetOctopus’ Search Console Module.
Pages Growth and Drop Breakdown of JetOctopus’ Google Search Console Module
JetOctopus also has a quick breakdown segmentation for the web pages from a source. According to impression and click counts, you can group the pages to see which pages bring the most section of the organic performance.
Below, you will see a breakdown for the pages with growth according to their impression and click growth. Pages with 11-100 click/impression growth, pages with 101-1000 click impressions growth and pages with 1001> click/impression growth are filtered and visualized below.
How about pages with drop? Below, you will see a segmentation for pages with drop in terms of click/impression.
This section of Google Search Console Module of JetOctopus is important because you can filter the pages that are underperforming, have high potential or vice versa. You can notice the Search Engine’s reflexes for your pages or page groups to filter them and find patterns.
Growth by and Drop by DataFrames of Dynamics Section
Last section of dynamics is actually a dataframe. It gives more and quick insights from the Search Engine’s perspective. With Growth by and Drop by Section, you can check all of the top performing and underperforming pages according to the date comparison.
Below, you will see an example. It shows the better performing pages at the left, and worse performing pages at the right.
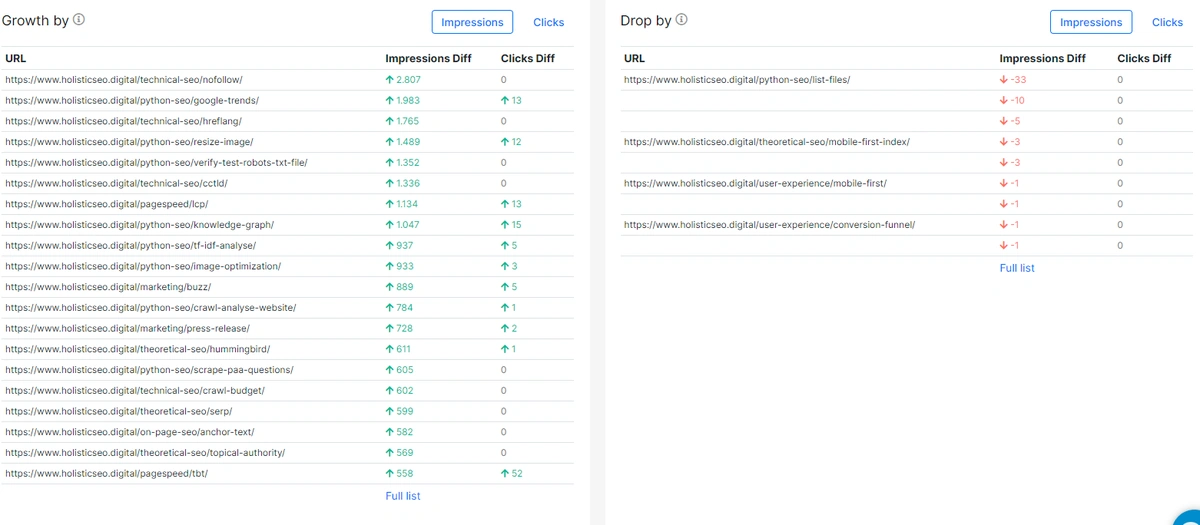
You can choose between the click and impression section as below.
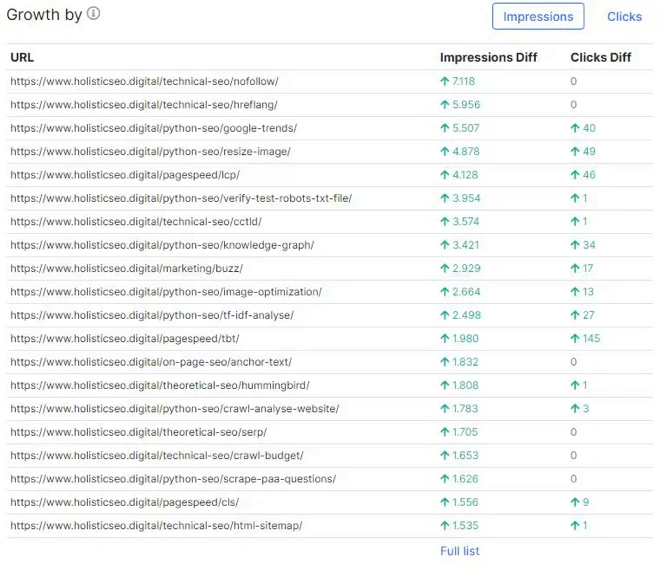
If you click to the full list, you will be able to see all of the related data and URLs in a dataframe as below.
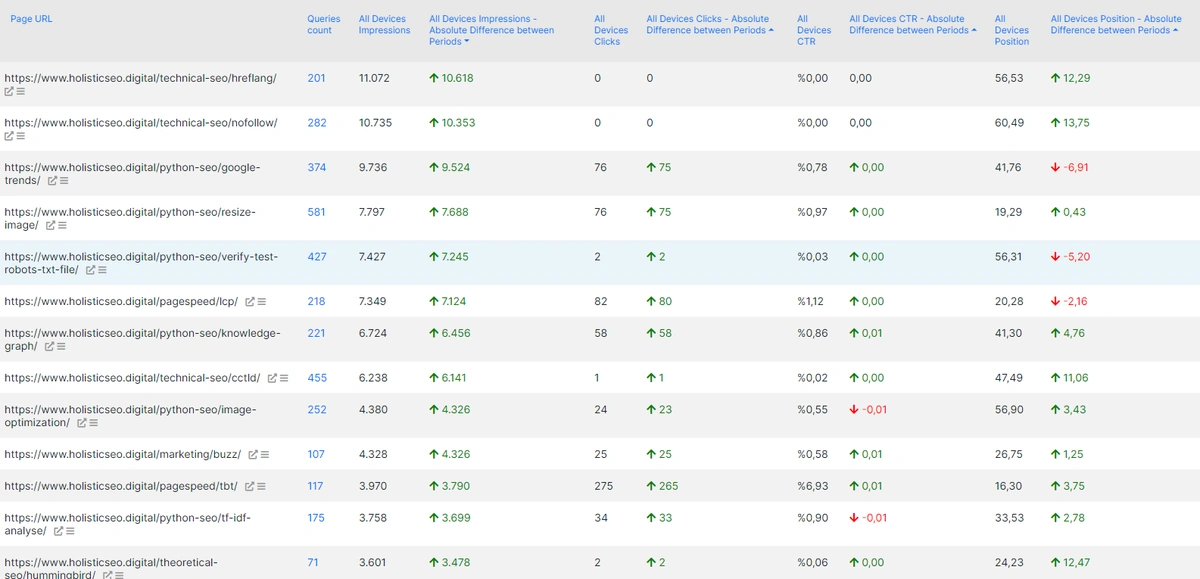
You can add more columns here or filter URLs according to your SEO Campaign’s needs. Since, Holisticseo.digital doesn’t have so many underperforming pages, I won’t zoom to that section, but “Growth by and Drop by Section of the Dynamics” is important to find some early SEO Problems.
Usually, Search Engines group the landing pages and sources on the web to perform quality tests, and to see some underperforming pages in the eyes of a Search Engine might give SEO insights to take some early precautions and find patterns between pages.
For instance, the pages below from a different source include lots of outdated campaigns and out-of-stock products.
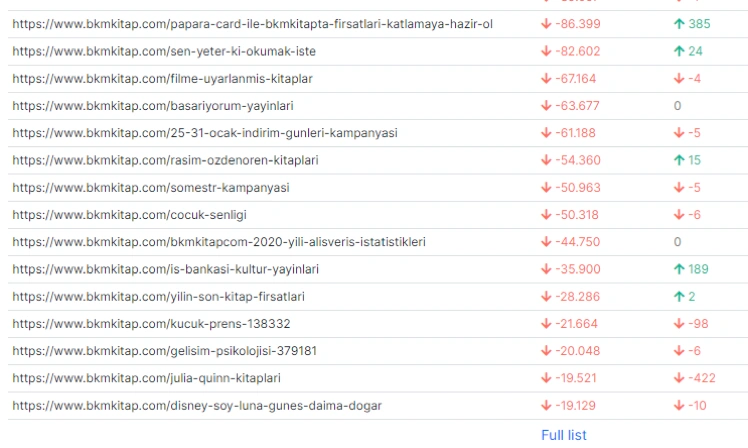
These types of situations can be a problem for a source (domain).
Insights Section of Google Search Console Module of JetOctopus
Insights section of the JetOctopus’ Google Search Console Module is the backbone of all data science and aggregation methodologies related to the GSC Data. In this section, there are lots of correlation and visualization examples that can show the potential of the source in terms of query count, query character and active/passive page counts.
Clicks by Position Section of the JetOctopus’ GSC Module
In this section, you can see how many clicks are produced at which rank of the SERP with which Click Through Rate (CTR). And, in the example below, we have a higher CTR at the 3rd rank than in the second rank. Also, we see that there is no big difference in terms of CTR between 3rd, 4th and 5th ranks on the SERP.
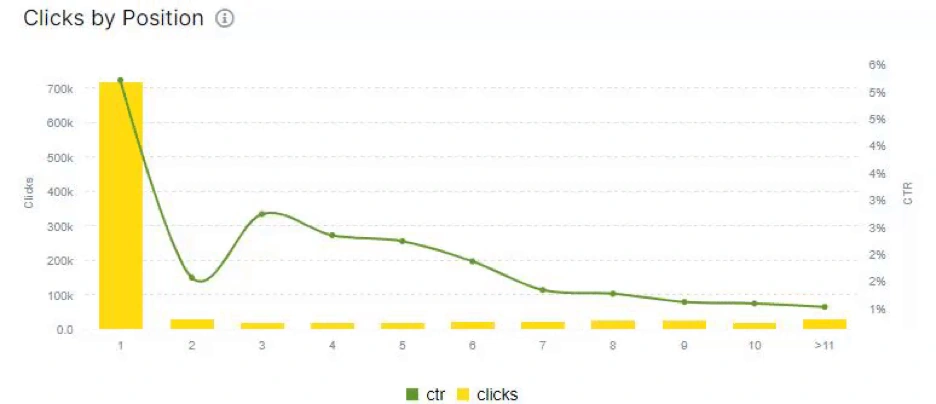
Thanks to this information, quickly you can see which section to be focused on more. And, if you click one of the dots in the screen, you will see all of these queries and their performance as we mentioned before.
You can find why the queries at the second rank have a lower CTR quickly. In this case, most of these queries were “branded queries” and the CTR has been shared between other URLs of the same source. But, also it might be related to a kind of special situation for certain types of queries that trigger some types of SERP Features.
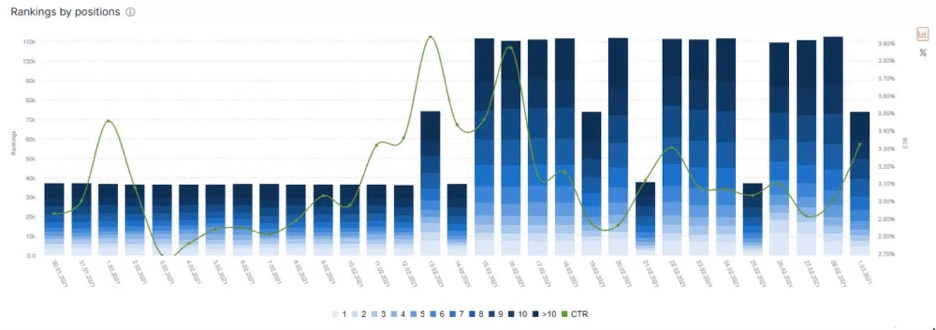
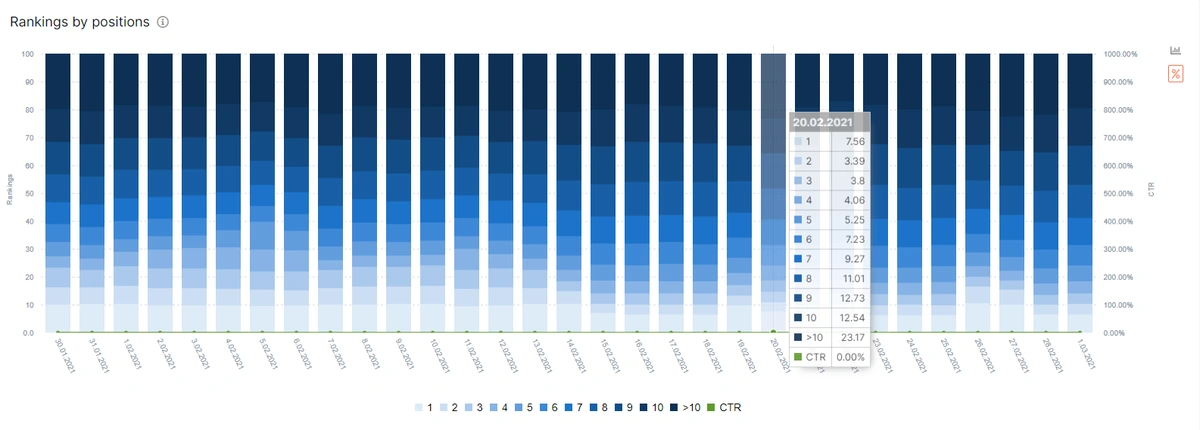
Rankings by Position Section of the Google Search Console Module of JetOctopus
Rankings by Position section of the GSC Module of JetOctopus completes the Clicks by Position data. It shows that this site has lots of queries that it doesn’t rank in the first 10 queries. And, we know that this site creates 820.707 clicks at the queries at first rank from the Clicks by Position graph. In this section, we also see that it has 12.419 queries at the first rank with the 5.15% CTR.
It shows how many queries produce how many clicks at which rank with which CTR. Thus, finding the quick gain opportunities in the SEO Campaigns is easy. Thanks to this insight, we clearly know that this source has a great potential that is buried after the first page on the SERP. Query length is also an important character signal for search intent and behavior, in this context JetOctopus Google Search Console Data Science and Assistant module has this option too.
Queries Performance Counts by Words Section of Google Search Console Module of JetOctopus
Queries performance counts by words section shows how many words these queries have and what is the CTR value for these queries. By clicking these dots, you can see the character of these queries easily.
This information is important because usually long-tail queries have better conversion rate, and all of the queries focus on a different section of the Conversion Funnel. By creating a conversion funnel analysis template in Google Analytics and grouping the queries in terms of conversion journey sections, you can calculate the SEO ROI in a more effective way.
Also, you can see which types of queries can be improved in terms of SEO Performance.
For instance, above, you can see all of the queries that are 5 words and their performance. And below, you will see the Overall Performance for these queries.

By Query Words Section of Google Search Console Module of JetOctopus
We saw the query word count and their CTR value along with their counts in the previous section. Below, you can see how many clicks and impressions create these queries according to their word counts.
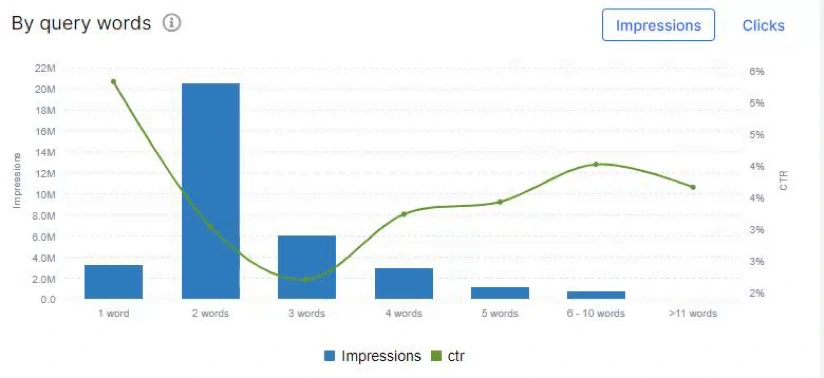
“By Query Words” section shows the performance of the queries by classifying the queries according to their word count. By clicking the clicks or impression button, you can check both easily. And, in this section we see that most of the organic search value comes from queries with two words. But queries with words between 5-11 have better CTR and probably better conversion rate.
Active Pages by Group Section of Google Search Console Module of JetOctopus
“Active Pages by Group Section” groups the web pages from a source according to their performance with specific breakdowns. For instance, you can see which pages have only one visit for the dates that have been chosen. And in this example we see that more than 5400 pages have only one visit while they produce way much more impression.
Also, we see that only 31 pages have created more than 1000 visits. This shows that most of this site is passive, and the active section of the web site is not authoritative, quality and active enough. By clicking, you can export all of these pages to examine deeper and more.
And, you can also see the query count that these pages create impressions from. By clicking these queries you also can filter these queries. You will see below an example that shows how to filter queries for only one URL.
We have extracted all the queries for a specific web page that creates only one click for the specified date range. Below, you can see the overall aspect of this page for these queries.

Positions Section of the Search Console Module of JetOctopus
The positions section is a quick summary section if you don’t have enough time to deep dive all these charts, plots, data frames, filtered dimensions. Below, you will see one of the most comprehensive SEO Data Visualization examples.
Positions section has only one graph that summarize the four main things directly:
- How many queries are being ranked for a specific date
- At which ranking, how many queries are being ranked for a specific date
- What was overall CTR for the specific date.
- How the ranked query count changes per day.
And, the Positions section shows many things indirectly in terms of SEO:
- How the site has been affected from a specific date.
- How the overall CTR changed because of a certain query increase from a specific rank.
- How well the overall ranking concentrate to the which ranking range
- At which date how many impressions and clicks produced
- How well the site is performing for its true potential
There are two other features of the Positions Section.
You can compare the desktop and mobile ranking and CTR differences.
And you can use the logarithmic scale at the Y Axis. Speaking of Y-Axis, you can’t see multivariate Y-Axis all the time in the SEO Data Visualization industry.
After all these important sections, we even didn’t start to show the real stuff that JetOctopus has its own Google Search Console Data Science vision. Let’s move to the Cannibalization Section that shows how a source can consume its own ranking signal by competing against itself.
Cannibalization Section of Google Search Console Module of JetOctopus
How to find keyword cannibalization from Google Search Console Data? In 2018, I have created my own Data Studio tool to find keyword cannibalization. In 2019, I have started to use Python for the same task. And, now there is another option if you are not familiar with these alternative methods, Cannibalization Report of JetOctopus.
A proof of JetOctopus’ detailed vision can be found in the cannibalization section, because they differentiate the mobile search cannibalizations and desktop search cannibalizations from each other.
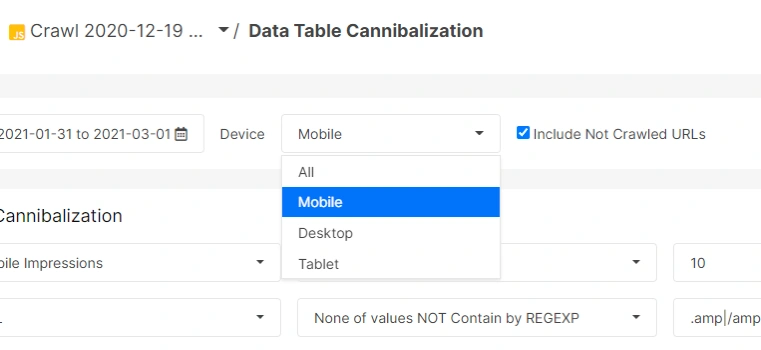
And, also you can filter the cannibalizations according to their intensity level.

You can filter cannibalization examples according to the clicks data or their URL breakdowns to work on them easily. And, any cannibalization example is a proof that a source is not optimized according to the Semantic Search with Semantic SEO Principles.
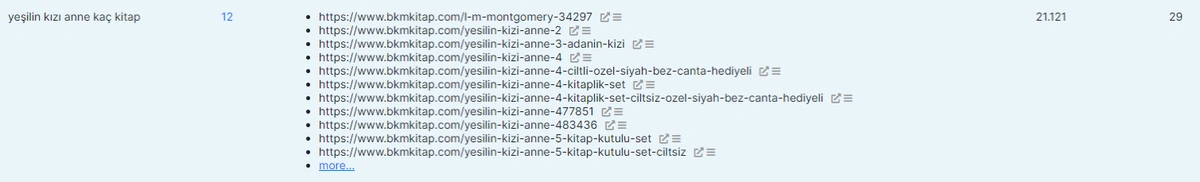
In Semantic Search and Query Network, every page and its sections has a clear intent and relevance for a topic, if two pages from the same source tries to compete with each other for the same topic and query network, it means that the source is sharing its ranking signal between those pages. Unorganized sites suffer from query cannibalization, and JetOctopus’ cannibalization report is an easy way to explore them all.
Query on the Page Section of the Google Search Console Module of JetOctopus
Main purpose of the Query on the Page Section is to show the unused OnPage SEO power of the web pages for specific queries. If a page takes lots of impression from a query but the query doesn’t occur in the page’s title tag, it means that the web page doesn’t use its all relevance potential for the users’ relevant queries.
In this case, normally controlling all these titles, checking them, fixing them one by one would take an enormous amount of time. With JetOctopus, creating an effective Title Tag Optimization Campaign is easy.
And, these potential can be found for mobile, tablet and desktop separately. You might think that this kind of SEO optimization is easy, but Information Retrieval and Extraction systems of Search Engines relies on “relevance signals” with matching terms between documents and queries. These matching occurrences can happen in title tags, URLs, heading tags, paragraphs, anchor texts, or in images’ alt tags, etc… Checking all of these and giving a more confident relevance signal to the Search Engines is important.
To use the Query On the Page section as more effective, I recommend you to exclude the branded terms with the JetOctopus’ Data Filtering Assistant.
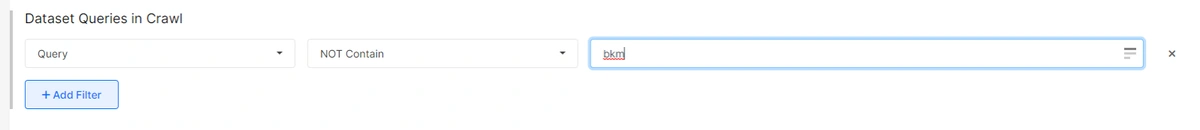
Then click to the selected section to sort the values as ascending according to the “Query in title ratio” column.

You will find lots of OnPage Optimization opportunities.
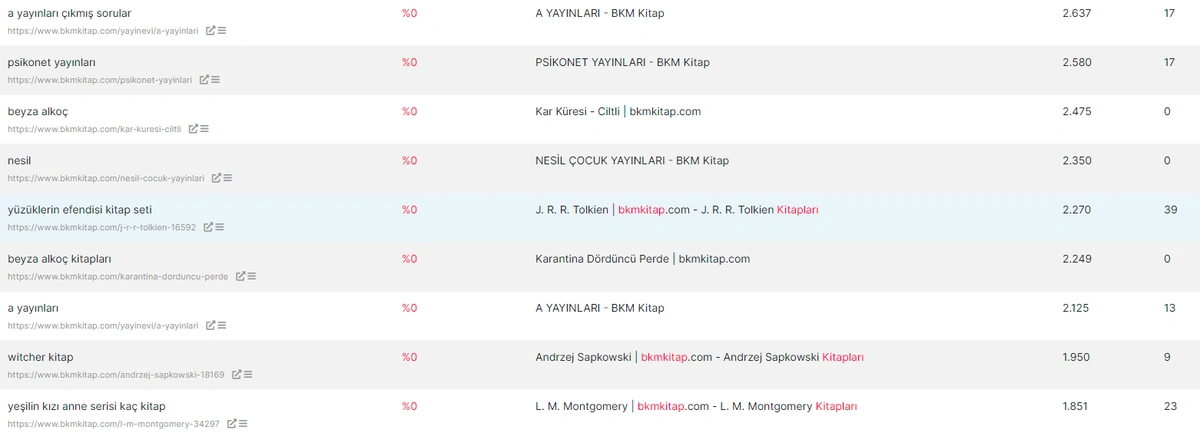
As you can see we have more than 2.000 impressions and mostly CTR under 0.5%.
Query in Meta Description
Query in the Meta Description section checks whether the valuable query is in the description or not. With the same methodology, you can give one more relevancy point to the Search Engines by including the targeted query in the meta descriptions.
The important thing here is knowing that the meta descriptions are not direct ranking factors, they affect the CTR and also Search Engine can see the meta description as a “summary of the page”. There are different types of meta descriptions such as unique selling point descriptions or question focused descriptions. Below, you will see a question focused description example.

With the Query on the Page section, you can think of different meta description strategies to improve the organic search performance.
Query in Heading One
Heading One (H1) tag is the primary tag of the HTML Document. It shows the topic of the HTML Document, and as a semantic HTML tag it creates the root of the document’s context. İncluding an H1 tag on the page and the relevant term within it is important. Also, position and style of the H1 tag is important.
With the same methodology, you can think of a different strategy that can create more relevance within the root element of the HTML Document which is the H1 tag in this case. You might think of writing relevant terms to the H1 tag while changing its design, or you can perform an A/B test while checking the competitors general strategy.
Keywords and Pages Section of the Google Search Console Module of the JetOctopus
Last section of the Google Search Console Module of the JetOctopus is Keywords and Pages sections. These sections are normally separate from each other but their context is the same. In other words, you can guess one from another, and one can help to perform an improvement for another.
All Keywords and Pages Sections
All Keywords and Pages Section includes all of the keywords and pages whether they are underperforming or best performing. JetOctopus has six different classification for keywords and pages, and these are below.
Lost Pages and Keywords
Zero Pages and Keywords
Winner Pages and Keywords
Loser Pages and Keywords
All Pages and Keywords
Besides these, there is also one group that is valid for only keywords, it is “New Keywords”. In this context, the All Keywords and All Pages section is actually for two things.
- Quick Data Export
- Quick and Custom Data Filtering
In the All Keywords and Pages Sections, you can simply extract all the data, or you can create your own filtered and customized data table to export it.

At the top of the section, there is a board that includes the overall situation for these keywords. And, there is of course device based and date based filtering options. Below, you will see another overall data board from just the All Pages section.

Same data. The only difference is the perspective, one is coming from pages, and other is coming from keywords. Below, you will see the all pages dashboard.
You can take all the pages with their queries, performance data and performance change according to the previous period. Below, you will see the all keywords section.
Only the first column has changed from pages to keywords. Now, we see every page for every query with their own performance changes and overall situation.
For a deeper understanding of these dashboards’ value, we will continue with the “New Keywords” section.
New Keywords
JetOctopus is one of the unique tools that can show and tell you how many queries that your web site has ranked for a specific date for which devices and countries. Normally, this data can be tracked with third-party services but JetOctopus extracts this information from the Search Engine’s data, directly. Thus, it is important.
The New Keywords section shows the keywords that are not being ranked in the previous period but ranked during the last period.
Above, you see new queries and which pages are being ranked for them with what performance metrics. With the New Keywords section, you can find how well your SEO campaign gives the results, or what can be done to make this potential to grow even better.
Lost Keywords
The Lost Keywords section is the opposite of the New Keywords section. In other words, it shows the queries that are being ranked in the previous period while not being ranked in the last period. It is important to check this section to see at which keywords are not being ranked anymore.
And, above you can see a filtered lost keywords data frame. You can use the “Query On The Page” section with Lost Keywords section to improve these pages’ performance for these queries.
As a note, since JetOctopus extract queries with the impression data, in some cases some queries may have zero search demand or volume according to the previous period, thus, also these queries might be seen as “lost queries”, but in fact they are “searchless queries”.
While evaluating the SEO Performance via “Lost Keywords” section, this also should be remembered.
Zero Click Keywords and Pages
Zero Click Keywords are the keywords that have not produced any clicks for the selected source. Below, you can see the overall performance of these queries for the source.

We have 112.296 queries that have produced 3.571.058 impressions but zero clicks. A note should be taken here, if a source shows 5 pages for a query, but only one of these pages take the click, it means that this query is a “Zero Click Keyword” for other 4 pages. Thus, in this context, you should know that the source might take the click from these queries, but some certain pages from the same source might not. That’s why Zero Click Pages should be used with the “Cannibalization” section.
Below, you can see a data frame example with zero click keywords.
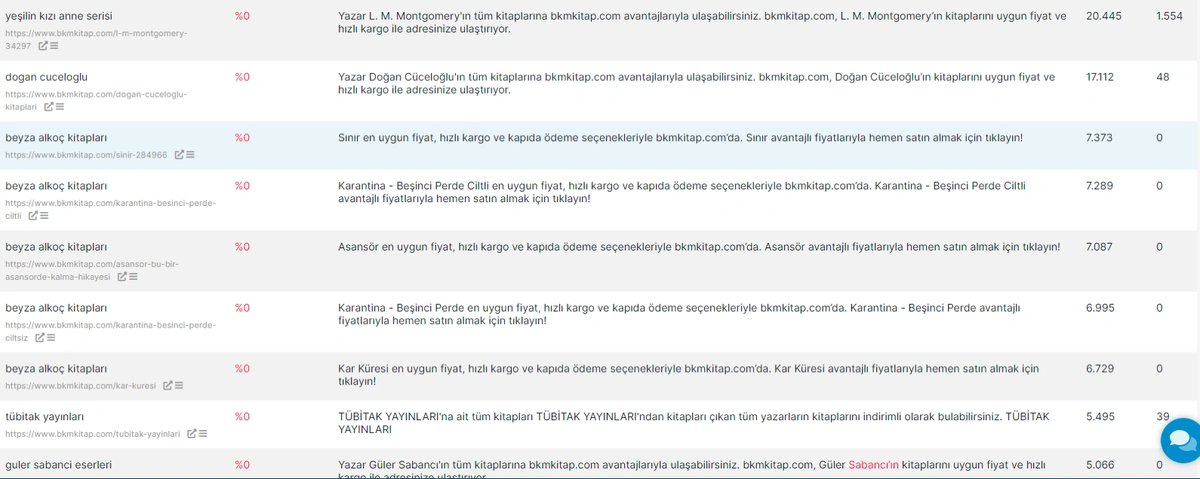
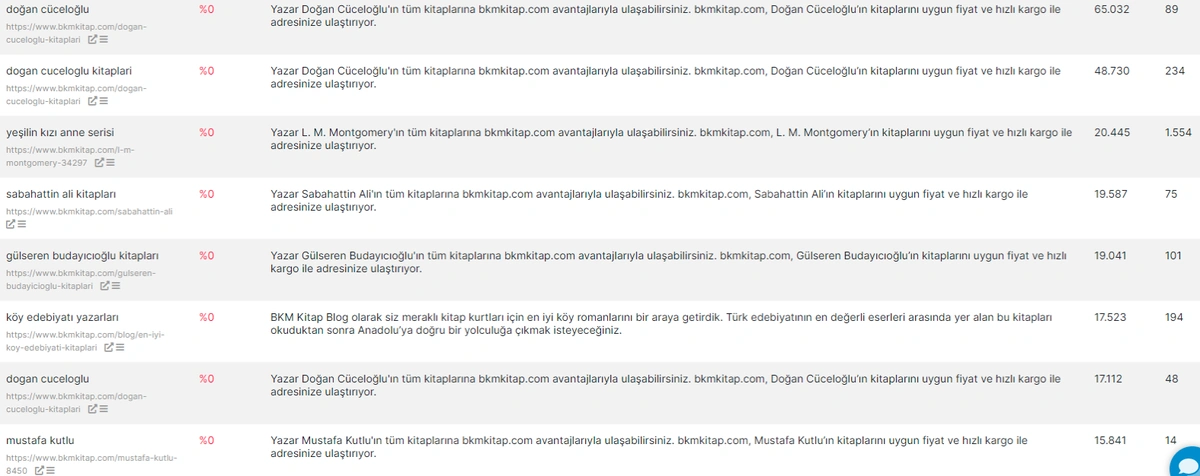
In this example, the index column or the first column includes the all queries with zero clicks for specific URLs. At the right side of the data frame, you can see the “0”s and impression counts. Below, you can see a data frame example with zero click pages.
This time, the index column (first column) includes the URLs, the second column includes the queries that the specific URL has ranked, product impression but didn’t any click from. Thus, by clicking these queries, you can examine them to understand the general pattern of this situation. Below, you will see a filtering example.
Winners and Losers for Pages and Queries
JetOctopus has a semantic structure within its GSC Module. Like the queries and pages complete each other, also the winners and losers reports complete each other. All the losers and winners reports have 5 mutual sections.
- Winner and Loser in the context of Impression
- Winner and Loser in the context of Click
- Winner and Loser in the context of CTR
- Winner and Loser in the context of Position
- Back to Top 10
- Gone from Top 10
In this context, JetOctopus’ Google Search Console Module covers most of the related things for an SEO Campaign’s URL and Query performance analysis. Let’s examine these sections.
Winner and Loser Pages and Queries in the Context of Impression
JetOctopus’ Google Search Console module can give all the pages’ and queries’ performance change compared to the previous period. Thus, examining a web site’s different dynamics from different dates become easier.
Below, you will see all of the winner pages.
The example above shows the all of the winners for impresion values, in other words these pages can be a winner in terms of an Impression but also a loser in terms of position. Thus, sometimes you see “minus” signs in the position section. Below, you will see the queries with impressions lost according to the previous period.
By checking these queries and pages, you can try to find the main reason for these changes, it might be related to the search trends, or an update. And, above you can see some examples that increase its rankings more than 20 but still lose impressions. It means that the trends were not enough for these periods, but also there are lots of different patterns and situations.
Winner and Loser Pages and Queries in the Context of Click
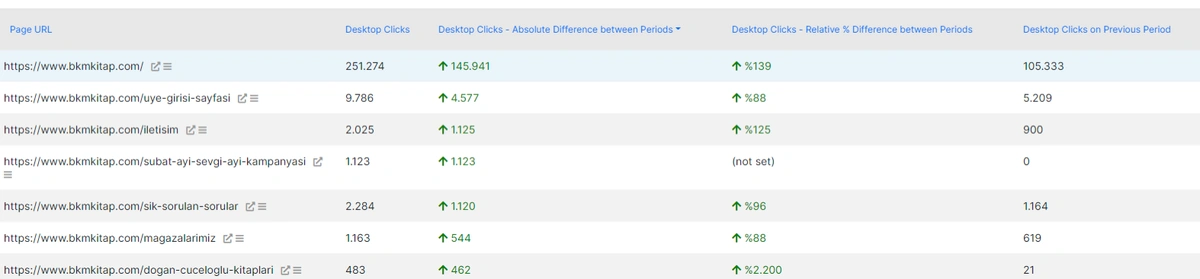
Click data is more definitive than the impressions. Impression is related to the search visibility, clicks are related to the search activity. And, without activity, visibility doesn’t have a big value. Thus, checking the winner and loser queries and pages in terms of click data is important. Below, you can see the winner pages in terms of clicks.
Above, you can see pages that increase its performance in terms of clicks. And, the better part is that you can check all these data based on device differences. Below, you can see the mobile click differences.
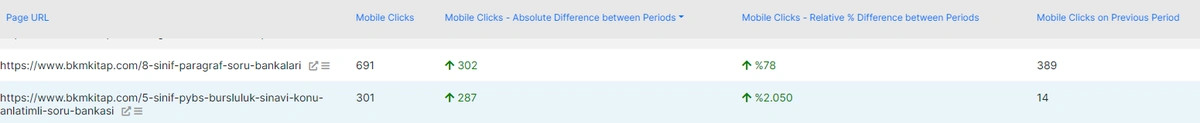
And, below you can see the same data for desktop clicks.
JetOctopus also gives “click difference” as quantity and percentage like in other sections which are important again. Below, you will see the loser queries for the same period of time for mobile devices.
Again, checking this section with Cannibalization and Query on the Pages section could be a big help for an SEO.
Winner and Loser Pages and Queries in the Context of CTR
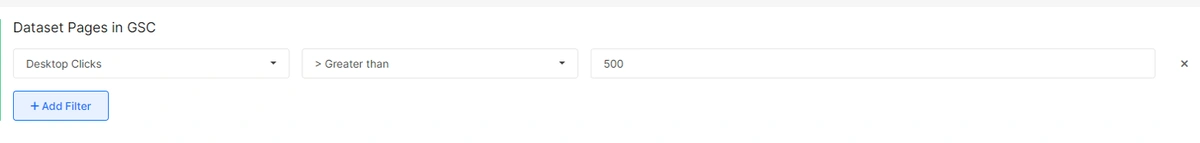
CTR Data also can be checked easily for a quick comparison in the context of device, date and pages, queries context. Below, you will see the winner pages in terms of CTR for desktop organic search performance.
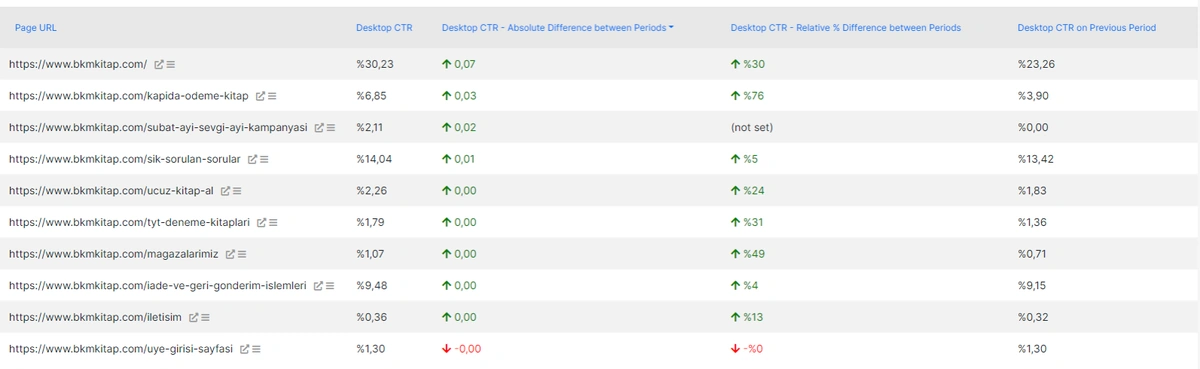
The URL count here is fewer because I have filtered URLs according to their click count. I have taken only the URLs that have more than 500 clicks.
Below, you will see the loser queries in terms of CTR for all devices.
Again, there are fewer URLs, because I have used a more complex filtering option this time.
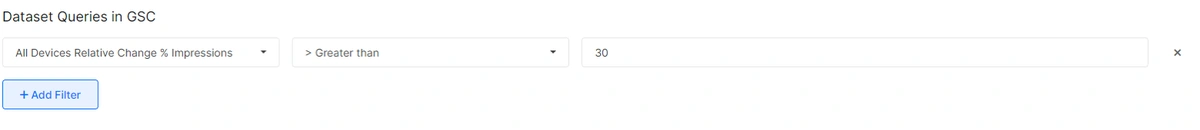
It says “All Devices % Impressions” change means that take the queries (and pages for these queries) or queries according to their impression change for the previous period. In this example, I have filtered queries that have an impression change bigger than 30% while still losing in terms of CTR. Thus, we can find all the problematic areas or SEO organic visibility quick win opportunities in a source.
Winner and Loser Pages and Queries in the Context of Positions
Positions… The key for the most of the SEO Campaigns. In other words, “Rankings”. Instead of the “rank”, Google Search Console uses the term “position” or “average position”. Whether you call them “rank” or “position”, they are vital for SEO. With JetOctopus, we can check the pages’ average position change for different queries, devices, dates while filtering and segmenting them.
Below, you can see the average ranking changes for the pages that have more clicks than 450 in desktop devices and also in the sitemaps.
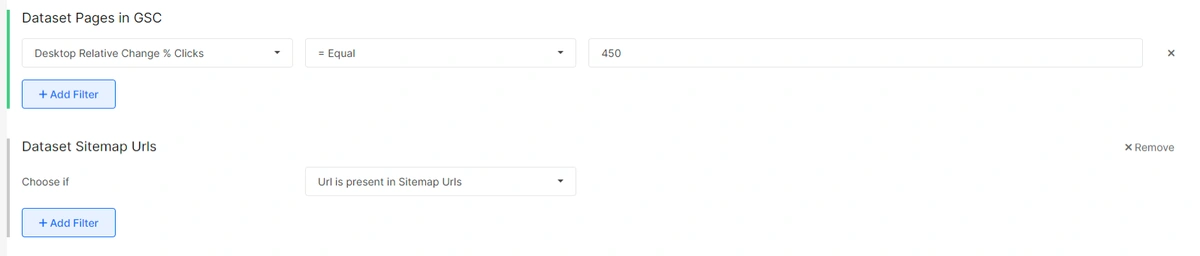
According to the filtering settings above, you can see the output below.
Below, you can see the loser queries in terms of position data.
Below, you can see a more detailed section of the data frame columns.
It gives the new position data, old position data and relative/absolute change percentage between selected the date range. You can combine these data with also log files to see how Google treated these pages, and you can correlate these data with their update dates.
Now, we can process the last section of the GSC Module of JetOctopus.
Back to and Gone from Top 10 Section
This section is actually a popular filtering option. It collects all the pages and queries according to their position data for the previous and current period.
- Back to the Top 10 collects the pages and queries that are not in the first 10 in the previous period while in the top 10 results for the current period.
- Gone from Top 10 collects pages and queries that are in the first 10 results in the previous period while not in the top 10 results for the current period.
Below, you can see the filtering option of the “Back top Top 10”.
Below, you can see the filtering option for the “Gone from Top 10”.
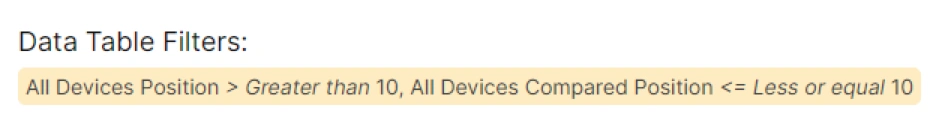
In JetOctopus’ filtering system you can create your own quick filters to create these types of insightful data extraction and data frame creation methodologies. Below, you will see the “Gone from Top 10” section for the queries.
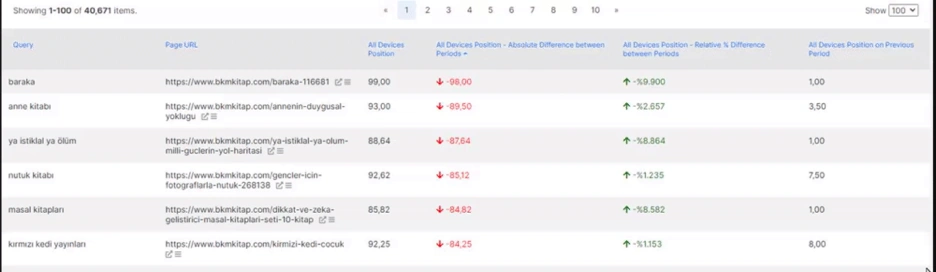
Below, you will see the “Back to Top 10” for URLs section.
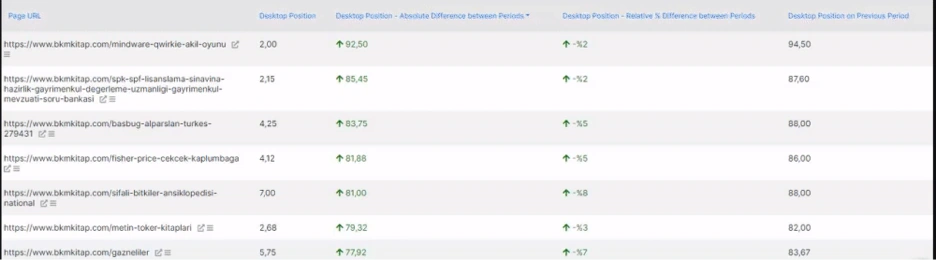
You can use the “Back to Top 10” and “Gone from Top 10” sections with “Ranking by Position” and “Clicks by Position” sections also. These two graphics show you how well you can create a growth strategy with the source’s ready-to-go potential in a quick way. JetOctopus’ all filtering and data science perspective is built on creating fast organic growth with a cost effective way for SEO Campaigns.
Before the finishing, we need to show also some other sections that have value.
Filtering System of JetOctopus’ Google Search Console
Filtering System is an important aspect for a SEO Data Science and Visualization tool, also a Technical SEO Crawler. In this context, I can say that JetOctopus is one of the best. Below, you will see a quick overview for the filtering strategy range for Google Search Console Data.
JetOctopus’ GSC Module has the filtering options as below.
- Page URL
- Queries Count
- Mobile/Desktop Impression
- Mobile/Desktop Desktop Click
- Mobile/Desktop Desktop CTR
- Mobile/Desktop Desktop Position
- Mobile/Desktop Desktop Missed Clicks
- Mobile/Desktop Compared Impression
- Mobile/Desktop Compared Clicks
- Mobile/Desktop Compared CTR
- Mobile/Desktop Compared Position
- Mobile/Desktop Difference Impression
- Mobile/Desktop Difference Clicks
- Mobile/Desktop Difference CTR
- Mobile/Desktop Difference Position
- Relative Change % Impression
- Relative Change % Clicks
- Relative Change % CTR
- Relative Change % Position
JetOctopus’ GSC Module has the quantitative filters for numbers as below.
- Between
- NOT Between
- = Equal
- != Equal
- > Greater Than
- >= Greater or equal
- < Less Than
- <= Less or equal
JetOctopus’ GSC Module has the quantitative filters for strings as below.
- Contain
- NOT Contain
- Contain by REGEXP
- NOT Contain by REGEXP
- = EQUAL
- != Not Equal
- Starts with
- Ends with
- Is Empty
- Is NOT Empty
- Is Absolute
- Is Relative
- Domain
Quick DataSet Join Options with JetOctopus
Data Filtering is important, but JetOctopus also has a setting for “Data Blending”. Data Blending is important to create data correlations and SEO Insights. JetOctopus’ has some quick data blending options for SEOs as below.
- Crawl Pages
- Bot Logs
- SEO Active Pages
- Sitemap URLs
- In Links
- Links On Page
From all of these Data Blending Options, the “Crawl Pages” and “Bot Logs” are the most important ones. Because, in normal conditions, you will need to know a little bit of Python and Data Science or Visualization to blend GSC Performance Report and Log Files.

But in JetOctopus it is a kind of built-in feature. You can check which pages are being crawled, which pages have more queries or is there a correlation between these two.
Import Data Option
Import data option will give you a chance for importing different data dimensions to your SEO Analytics tool which is JetOctopus in this case. Most of the Technical SEO Crawlers don’t have an option to custom data imports, and these custom data options can be anything. It can be your website’s off page profile, order count, multi-session information or conversion rates of your URLs, and also it can be your page speed information.
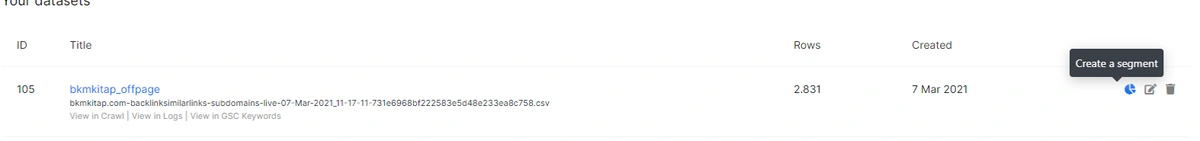
For instance, you will see that I include the example site’s off page data via the JetOctopus’ Import Data Module.
When you import the data, you can choose the data column labels and their data types. The most important one here is the “URL Key”, because it will be used to unite all the data.
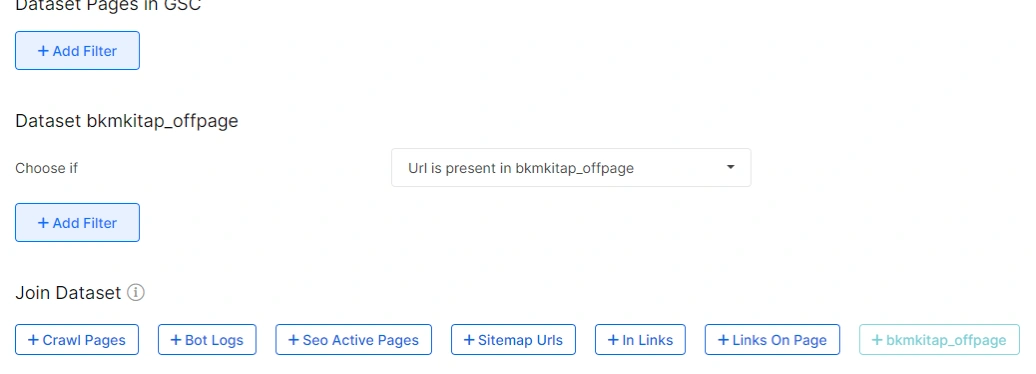
When you finish loading and arranging your customized data set, you will see “View Data” or “Join Data” options, in this case I have chosen to join the dataset to the GSC Pages.

When you click this option, you will see a “quick filter” option to filter the URLs that are existing only in the imported custom dataset.
And, if you want you can use these customizable datasets for creating quick site segments, from the same section (my data section), you can change the columns, labels and data types as you want.
Customizable data sets and data frames, data blending is an important aspect for SEO Data Science tools like JetOctopus, but we have more possibilities here, like Custom Columns Option.
Setup Columns Option
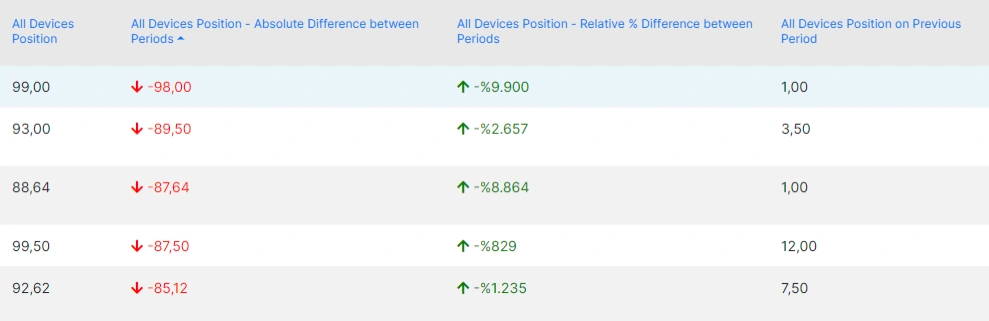
Another important option from JetOctopus’ GSC Module is the “Setup Column” options. In Python, one of the most important things for Data Science is the creating the right Data Frame. Creating the right data frame can take hours or maybe days and weeks. But, in JetOctopus’ built-in setup columns option, you can determine your own customized and merged datasets. Below, you will see an example.
Below, there is a quick list of “built-in data blending” options.
- Pages URL
- Queries Count
- All Devices Impressions
- All Devices Clicks
- All Devices CTR
- All Devices Position
- All Devices Missed Clicks
- All Devices Impressions on Previous Period
- All Devices Clicks on Previous Period
- All Devices CTR on Previous Period
- All Devices Position on Previous Period
- All Devices Impressions – Absolute Difference between Periods
- All Devices Clicks – Absolute Difference between Periods
- All Devices CTR – Absolute Difference between Periods
- All Devices Position – Absolute Difference between Periods
- All Devices Impressions – Relative % Difference between Periods
- All Devices Clicks – Relative % Difference between Periods
- All Devices CTR – Relative % Difference between Periods
- All Devices Position – Relative % Difference between Periods
And, these sections can be customized more for different sections of the GSC Module with specified attributes. But, without exporting the data frame, you can customize your dataframe and this is an important option for SEOs.
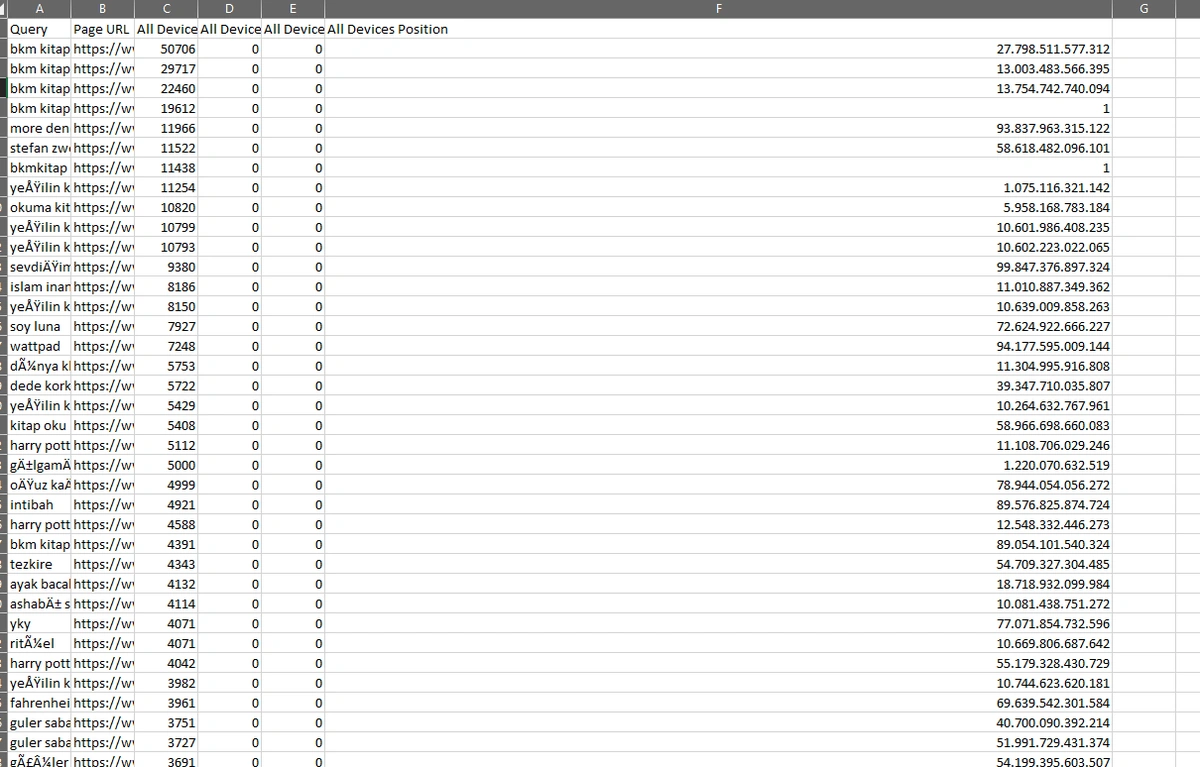
Exporting the DataFrame
In JetOctopus, you can export anything. I know that this explanation is short. But, this is the truth. Every data can be exported with the best possible customizable way you want. In the “Excel Format” there is a limit for 50.000 rows and I believe that for most of the sites, this is enough.

And, the CSV option doesn’t have a limit. When you click to the export, JetOctopus will give you a hint

And, when the export is ready, you will see the warning below.

When you click to the Export Option, you will see your previous exports also.
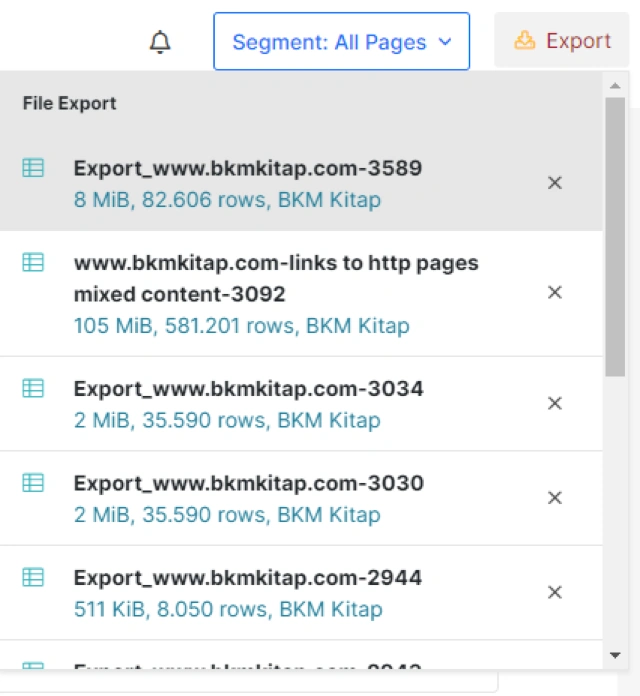
In 5 seconds, I exported a 8 MB and 82.606 rows of data.
And, if you want you can connect these CSV File to a Google Studio Data or Power BI, it is up to you.
Crawl These URLs Option
Crawl These URLs option is a valid option in the GSC Module. Imagine that you can filter every URL according to the lots of data dimensions and features, attributes while also being able to crawl them for a detailed SEO analysis. JetOctopus has a “Crawl These URLs” option in every page of the GSC Module. In other words, you can filter and crawl URLs while also grouping them. You will see an example below.
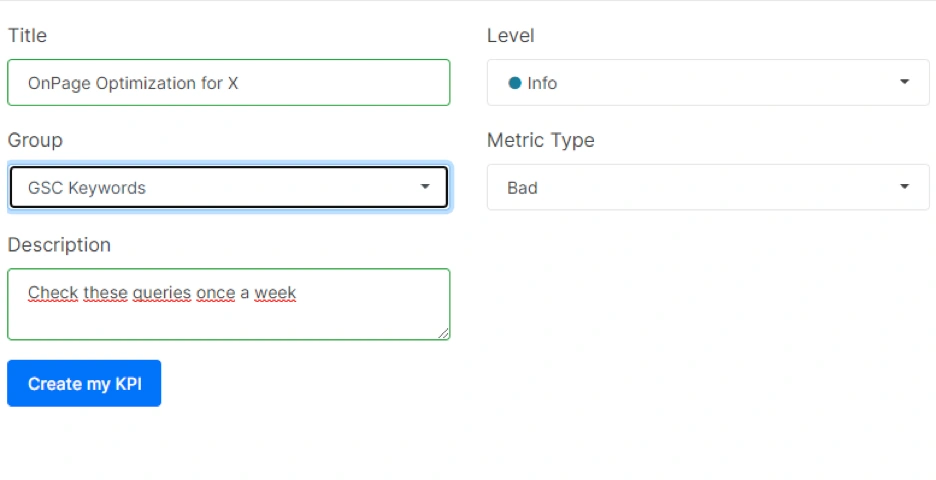
KPI Creation for SEO Campaigns
KPI Creation is a unique feature of JetOctopus. In some other SEO Crawlers and Data Science technologies, there are “task management” sections but choosing a KPI is actually related to the analytics and performance management for SEO Campaigns. In other words, in JetOctopus’ you can put some KPIs for your client and also your team so that you can track them within the dashboard.
There are three types of KPIs in JetOctopus’ system.
- Info
- Warning
- Critical
This classification is adjusting the KPIs according to their importance. And, also there is a metric type, it shows the “good”, “neutral”, “bad” sections so that you can give more character to your KPI.
There is also a group section that shows where you can record your KPI, for GSC Module,Crawl Module or Log Analysis module.
Above, you will see that I am creating a KPI that is called as OnPage Optimization for X at info level for GSC Keywords group with “bad type” metric with “Check these queries once a week” warning for myself.
When you enter your KPI Dashboard, you will see that you have categorized all these queries with a simple shortcut so that you can check these queries whether they are performing better or not.

This is a good way to create a “KPI Model” for every client so that you can filter every target, group and test easily and check them regularly.
Save as A Problem Option
Like in the KPI Option, you can also save something as a problem. For instance, URLs with 0 impression but also in the sitemap or URLs with zero clicks despite more than 10.000 impressions. You can filter these URLs and record them as a problem for a quick analysis or audit later.
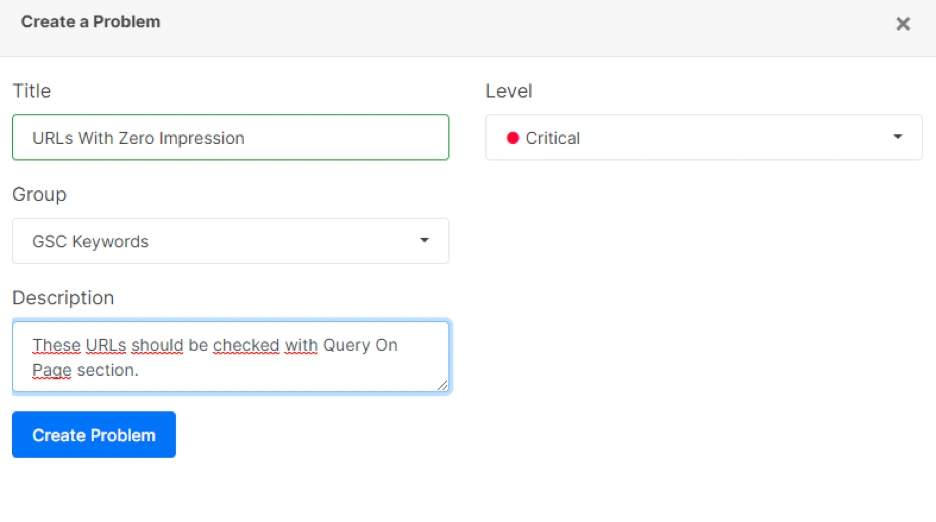
In the example above, I have registered a problem for a quick audit. After you save a problem, like in the KPI Section, JetOctopus will show you a shortcut for visiting your Problems Dashboard.

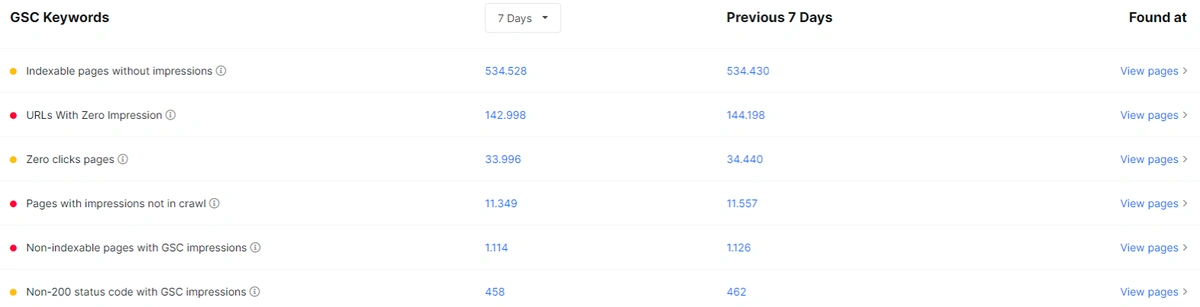
When you check your Problems Dashboard, you will see a “Date Range Selector” and built-in popular problem detection filtering system of JetOctopus. In other words, JetOctopus is already determined, grouped, classified and showed for you. You will see that our registered problem is at the second rank, and all the “color codes” are for a quick signal for the critical level of the problem.
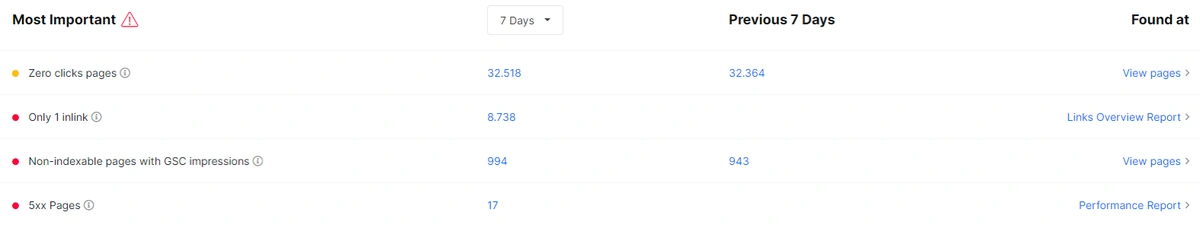
Below, you will see that JetOctopus also has a “Most Important” section for other types of problems.
Creating Segments for Quick Reports and Examinations
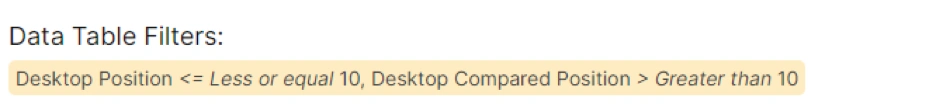
Creating Segmentation is important for SEO. You can create a segment according to the products, authors, prices, stock information, categories or just dates. It is up to you.
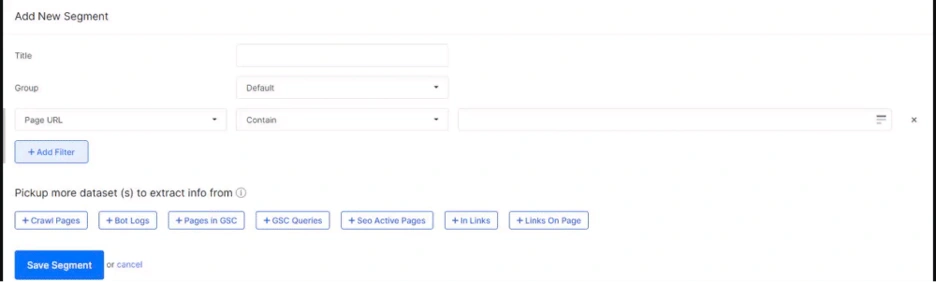
Above example shows different aspects and options for data filtering and how you can use it for quick site segmentation and SEO Insight extraction. You can use site segmentation for Page URLs, or crawl log files and internal links.
Ideas of JetOctopus for Quick SEO Wins with GSC Data
The last section that I will cover in this guideline, “Ideas” section of JetOctopus. In this section, you can find lots of different aspects and SEO Insights that are already extracted from the SEO Data. Below, you will see the “SEO Opportunities” section from JetOctopus.
There are two sections in the SEO Opportunities. One is the “SEO Crawl” and the other one is “GSC Keywords”. The GSC Keywords section has lots of quick SEO wins opportunities for a quick SEO Campaign launching.
In normal conditions, you would have a hard time to gather all this information but with SEO Automation of JetOctopus, it is one of the basics.
Last Thoughts on JetOctopus’ GSC Module and Holistic SEO
Holistic SEO is the true value and aspect of SEO, today. From Data Science, Data Blending, Aggregation, Manipulation, Filtering, and Visualization to Page Speed or Algorithmic Content Engineering… There are too many different columns that are important in the field of SEO. As a Holistic SEO, I can say that one SEO Expert is not enough for any company/campaign today. That’s why JetOctopus and its vision is important. It can extract, aggregate, group, filter, blend, customize all the data for quick segments, insights, problem detection and fixation for SEO Campaigns.
And, I can say that JetOctopus is one of the fundamental tools for Holistic SEO & Digital’s SEO Toolkit.
Koray Tuğberk GÜBÜR
Founder of Holistic SEO & Digital