Google Analytics and JetOctopus: best organic traffic insights
Google Analytics is a powerful tool that allows you to analyze customer behavior on your website. But quite often, SEO data and Google Analytics are separated and not considered together. We typically do not use Google Analytics as a source of SEO insights. The maximum we can do is to integrate Google Analytics and Google Search Console and monitor conversions and organic traffic. However, the JetOctopus team believes that combining data from all SEO-important sources is necessary to improve search engine optimization. In this article, we’ll tell you how to combine data from logs, crawls, Google Analytics, and Google Search Console to get a lot of insights about your SEO.
Analysis of the most effective pages
From the point of view of SEO, the most effective pages are those pages that have gone through the traffic funnel: from publishing a page on the website to receiving a conversion. Efficient pages pass all intermediate stages of the traffic funnel successfully: search engines scan these pages, then index them, rank them according to relevant queries. Then users see these pages and click on it. After clicking to the page, users make a purchase or perform another conversion action.
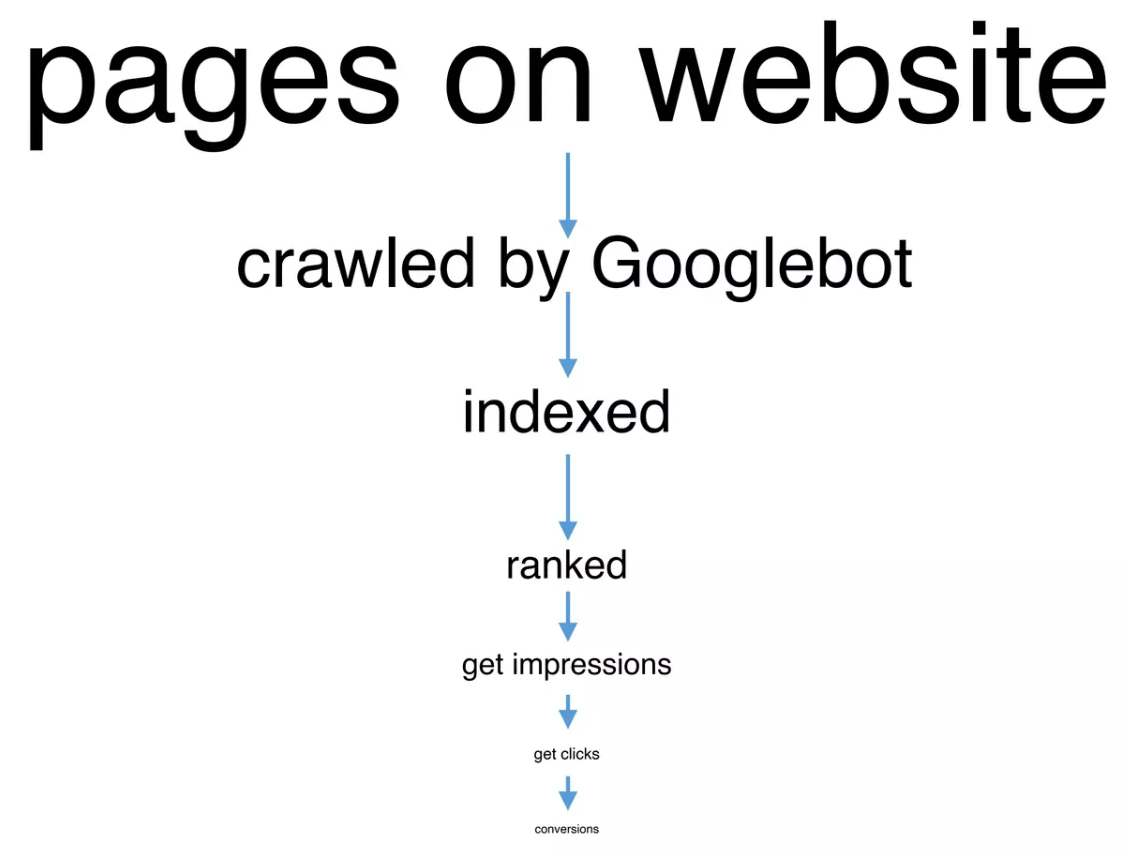
In an ideal world, 100% of published pages come this way and result in 100% conversions. However, at each stage, part of the pages disappear, so the number of conversions in real life is much lower relative to the number of pages and the number of keywords for which the page had impressions.
Therefore, it is very important to find out at which stage the most pages are lost. For this purpose, we suggest combining data from logs, crawls and Google Search Console.
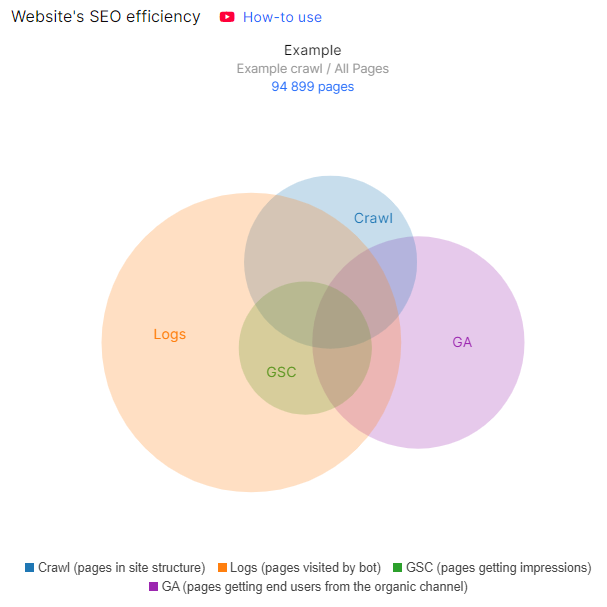
This data can be found in the “Ideas” section of the “SEO Efficiency” chart if you have integrated GSC, GA and logs data. The picture will be most complete and clear if you run a full crawl of your website and have logs for at least 30 days.
Ways to deliver great SEO insights
Now let’s analyze the most common cases.
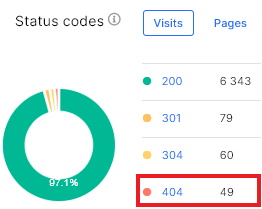
If you have many crawled pages, but much less visits by search robots, it means that you need to check whether there are no prohibition rules for crawling pages by search robots and whether everything is okay with the technical part of the website. It is also worth checking the status codes in the logs and finding all 404 and non 200 status codes. After all, the more non 200 status codes, the less often search engines will visit your website.
Internal linking is also of great importance.
In general, there is an obstacle for search engines to discover the pages of your website. Or search engines discover the pages of your website, but do not return for indexing content. Therefore, you need to delve into the technical analysis of the logs and understand why this is happening.
The following articles will help you find the reason:
Logs. Dig up the Pages mostly visited by bot and ignored
How to analyze heavy pages in logs and why it is important
Step-by-step instructions: analysis of 404 URLs in search engine logs
If there are many pages in the logs, but few in the crawl, it is worth delving into the analysis of the logs. Why do search engines visit so many pages? Are all these pages needed in SERP? Perhaps the crawl budget is spent inappropriately. Analyze your crawl budget and block unnecessary pages using the robots.txt file.
Another reason is poor internal linking. If there are many orphan pages on your website, not only the crawler but also the real users will not be able to find them on your website. The same is the case with pages that have a high DFI. These are the pages that are so deeply hidden in the structure of the site that you need to make a lot of clicks from the home page to get to it.
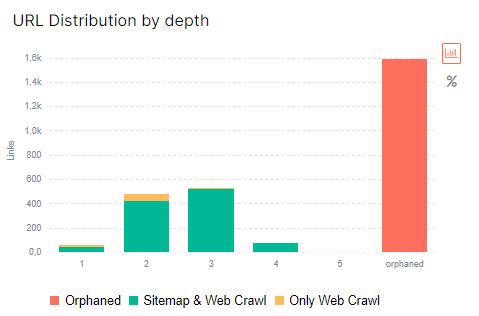
More information: What is DFI (distance from index) and how to analyze it.
If pages have many impressions but few clicks (low CTR), we recommend analyzing the relevance of keywords. Add position data and country analysis: this will help identify the problem.
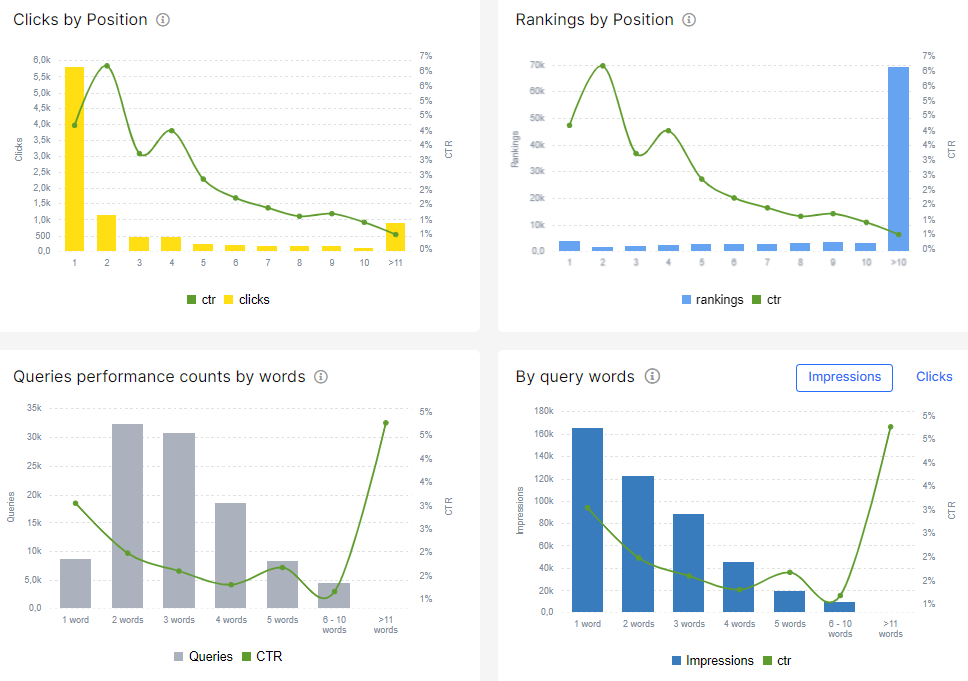
You may be interesting in: Insights from GSC: how to use this dashboard to create an SEO strategy
Finally, if there are many clicks but few conversions, add data from Google Analytics. Analyze the engagement rate, how long users stay on the page, and the bounce rate. Compare data for paid, organic and social traffic. Is the situation the same?
Possibly, the pages that are present in all 4 data sources (crawl, search engine logs, Google Search Console and Google Analytics) are the most effective part of your website. Analyze all the characteristics of these pages and extrapolate to all other pages of the website that should bring traffic.
All this data can be analyzed in the “Google Analytics” section.
General data from Google Analytics
Go to the “Google Analytics” section. In the “Overview” dashboard, you can set the desired period, country and traffic source for analysis.
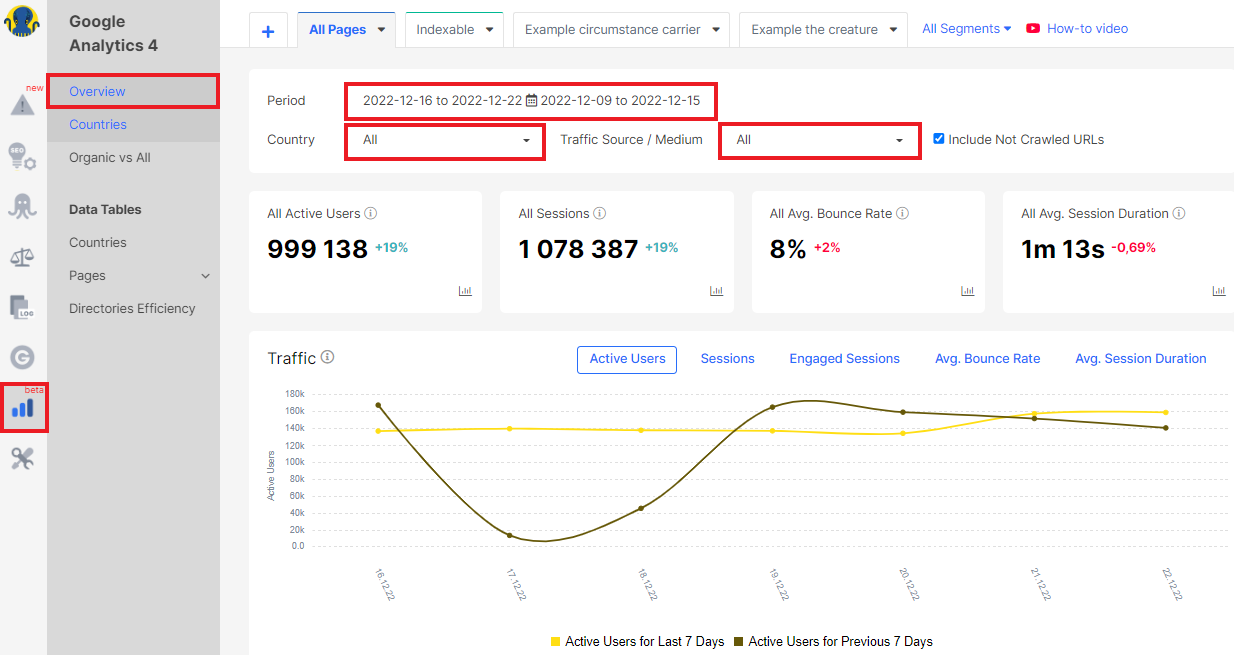
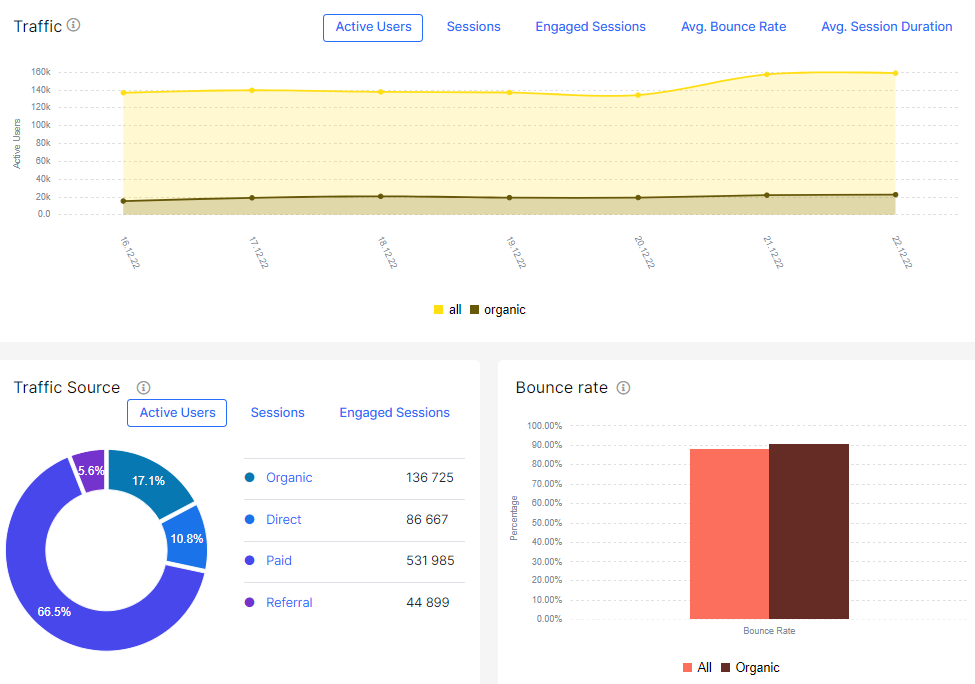
On this dashboard you will find information about active users, sessions, bounce rate and duration of sessions compared to the previous similar period. Notice how your traffic changes depending on the season and day of the week. How has the number of users changed? It may be that the number of users has decreased, but the number of sessions has increased. This means that users were returning to your website.
By the way, you can select a metric for tracking on the “Traffic” dashboard: the number of users, sessions, or choose another desired metric.
We recommend comparing weekly, monthly and year-to-year data. After all, it is normal that during Black Friday traffic will increase for e-comm websites, so the next week will have negative dynamics. However, compare last year’s Black Friday data: did your traffic increase compared to the previous year? This will be a more real indicator than a week-to-week comparison.
Traffic analysis by country
We also recommend analyzing traffic by country. To do this, go to the “Google Analytics” – “Countries” section. On the dashboard, you will find which country you are getting the most traffic from and the number of countries users were from during the period you selected.
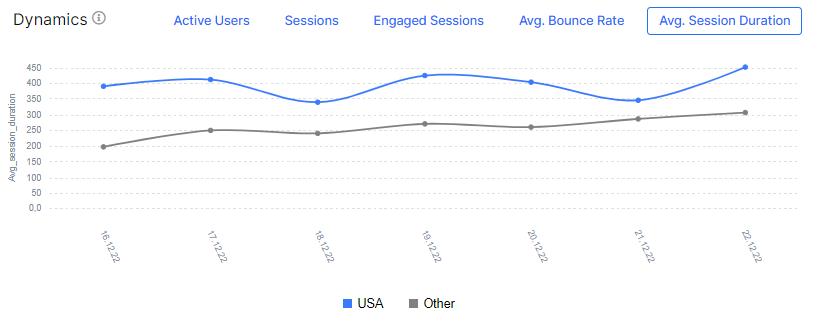
Pay attention to whether the top country by active users and sessions corresponds to the area of your website. What do we mean? If you sell apples in New York, it would be strange if most of the sessions are from Australia. It is unlikely that people in Sydney want to order apples in New York to deliver to Sydney or send apples as a gift to their friends and relatives in New York.
If you have this situation, analyze additional data by country in Google Search Console.
Why does this happen? Maybe local optimization is a problem? Pay attention to internal and external link anchors. If every anchor has “Australia”, then obviously the page will rank for queries in Australia. Misconfigured hreflang can also have an effect.
More information: How To Audit Hreflang
The main traffic should always come from the target country (or several countries) of your website. If the data differs, audit your local SEO settings.
Comparison of organic and other types of traffic
We already wrote above that it is worth comparing the main metrics of organic traffic with data for paid, direct, social and other types of traffic. In general, the situation should be approximately the same. For example, on holidays traffic will be less in general. But if you see a sharp drop in organic traffic, but paid traffic is normal, then the reason may be SEO technical problems with the website. For example, bugs with meta robots.
You can compare this data on the “Organic vs All” dashboard. Select the desired period and country and compare all indicators for different traffic sources.
Directories Efficiency
“Directories Efficiency” is a great data table that will help you understand exactly which types of pages are most effective on your website.
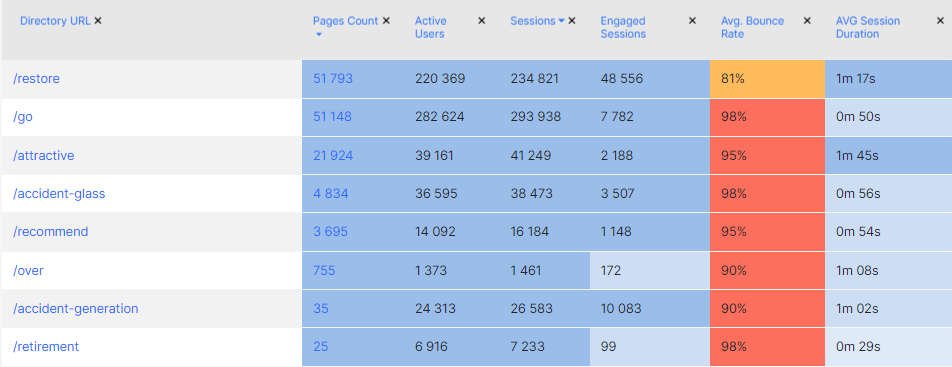
For example, these could be search-based or category-based pages. Another example of directory efficiency is language subfolders. If your website has several language versions and uses subfolders, you can use this data table to analyze the effectiveness of each language version. And if you filter the data by country, you will understand whether users always switch to the relevant language versions.
Conclusions
Using Google Analytics data in combination with other data (logs, crawl, GSC) will help you understand what is happening with your traffic and website in general and how technical issues affect conversions. With the help of comprehensive analysis, you can focus on priority tasks that will help get the most traffic.


